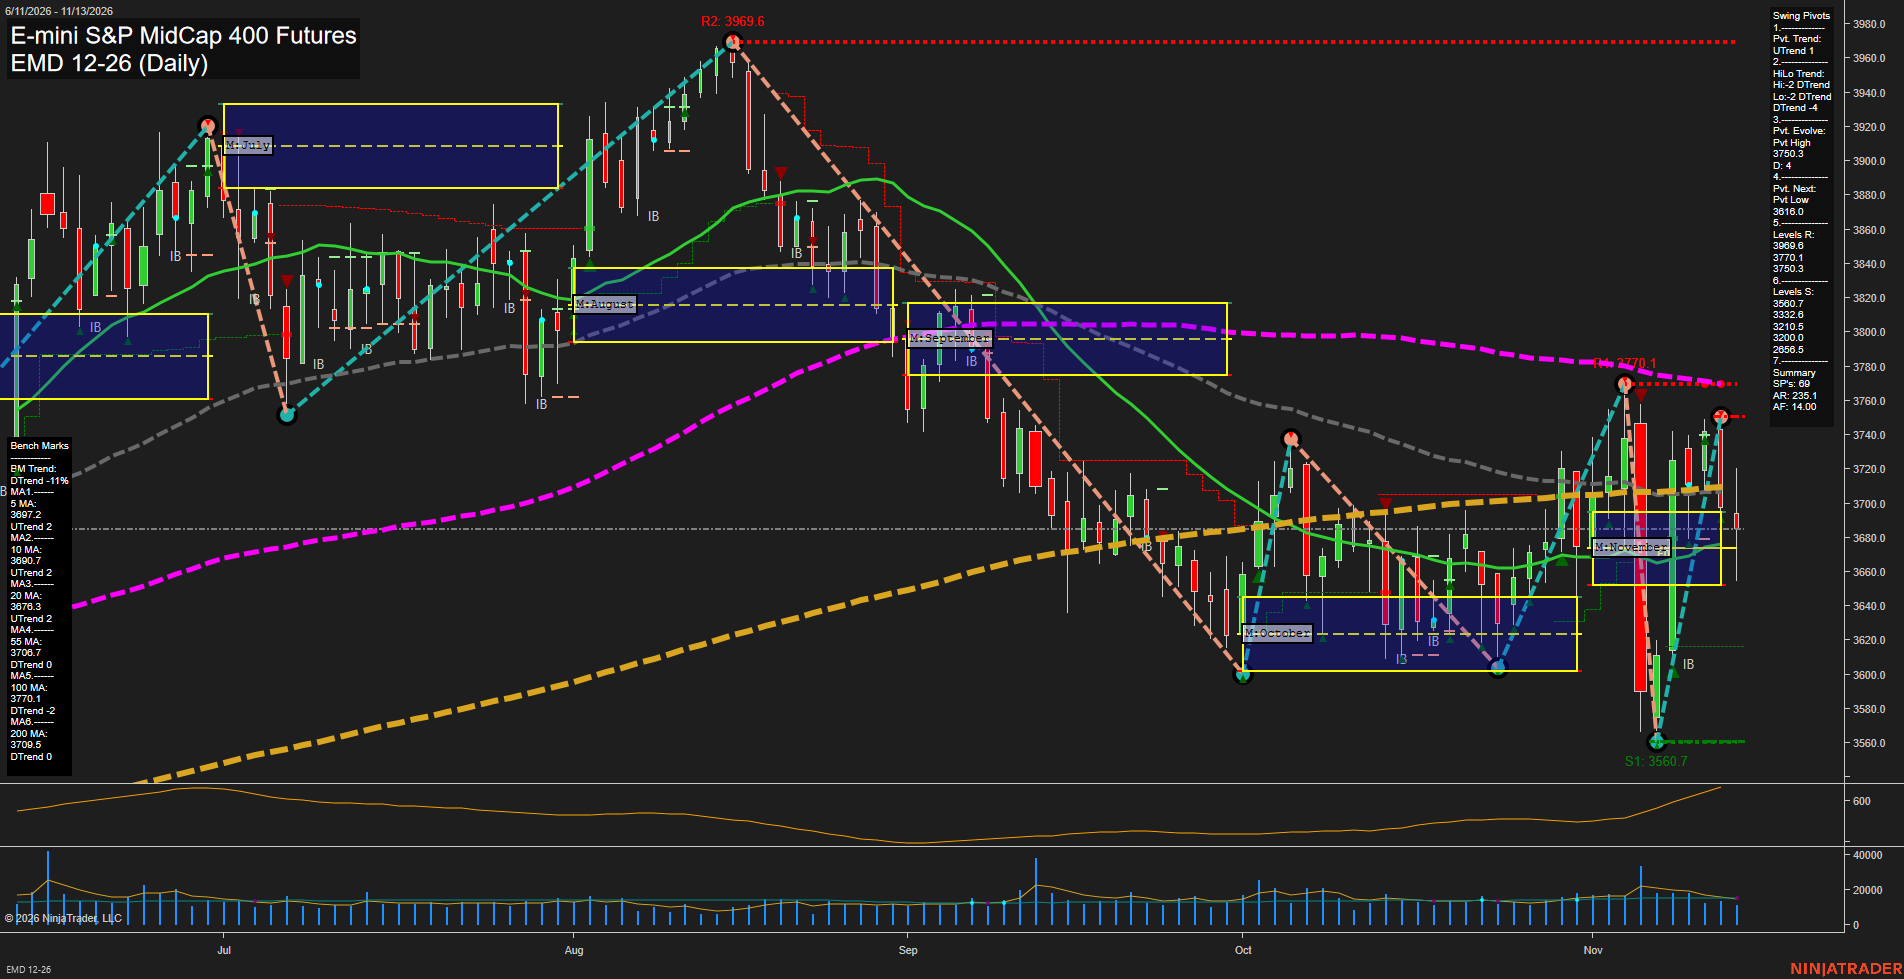
EMD E-mini S&P MidCap 400 Futures Daily Chart Analysis — Pre-Open: 2026-Nov-14 07:04 CT
Price Action
- Last: Approximately 3685,
- Bars: Large,
- Mom: Momentum fast.
WSFG Weekly
- Near-Term
- WSFG Current: 59%
- F0%/NTZ' Bias: Price Above,
- WSFG Trend: Up.
MSFG Month Nov
- Medium-Term
- MSFG Current: 7%
- F0%/NTZ' Bias: Price Above,
- MSFG Trend: Up.
YSFG Year 2026
- Far-Term
- YSFG Current: 35%
- F0%/NTZ' Bias: Price Above,
- YSFG Trend: Up.
Swing Pivots
- (Near-Term) 1. Pvt. Trend: UTrend,
- (Medium-Term) 2. HiLo Trend: DTrend,
- 3. Pvt. Evolve: Pvt high 3750.3,
- 4. Pvt. Next: Pvt low 3616.0,
- 5. Levels R: 3969.6, 3770.1, 3750.3,
- 6. Levels S: 3560.7, 3332.6, 3210.5, 3200.0, 2656.5.
Daily Benchmarks
- (Near-Term) 5 Day: 3697.2 Up Trend,
- (Near-Term) 10 Day: 3690.7 Up Trend,
- (Medium-Term) 20 Day: 3676.3 Up Trend,
- (Medium-Term) 55 Day: 3706.7 Down Trend,
- (Far-Term) 100 Day: 3770.1 Down Trend,
- (Far-Term) 200 Day: 3709.5 Down Trend.
Additional Metrics
Recent Trade Signals
- 12 Nov 2026: Short EMD 12-26 @ 3697.7 Signals.USAR.TR120
- 09 Nov 2026: Long EMD 12-26 @ 3625 Signals.USAR-WSFG
Overall Rating
- Near-Term: Bullish,
- Medium-Term: Neutral,
- Far-Term: Bearish.
Key Insights Summary
From a futures swing perspective, EMD shows a volatile countertrend recovery within a broader declining pivot structure. The rebound from 3560.7 reached 3750.3 but remained below the preceding 3770.1 swing high, preserving the medium-term lower-high pattern. Near-term bullish readings dominate the weekly grid, pivot trend, and rising 5- and 10-day benchmarks, although the latest pullback has placed price below both short-term averages. Price remains near the rising 20-day benchmark and within November’s neutral trading zone, above its center line, indicating consolidation rather than a confirmed upside breakout. The 3706.7–3709.5 benchmark cluster separates current price from overhead resistance, while 3750.3–3770.1 marks the recent rejection area. Large recent daily ranges and sharp reversals indicate fast but inconsistent momentum. The newer short signal conflicts with the earlier weekly long signal, reinforcing the distinction between the immediate pullback and the broader near-term recovery. Far-term conditions remain bearish by benchmark majority despite the positive yearly grid. No news catalyst or seasonal explanation is established by this chart.
Chart Analysis ATS AI Generated: 2026-11-14 07:04 for Informational use only, not trading advice. Terms and Risk Disclosure Copyright © 2026. Algo Trading Systems LLC.