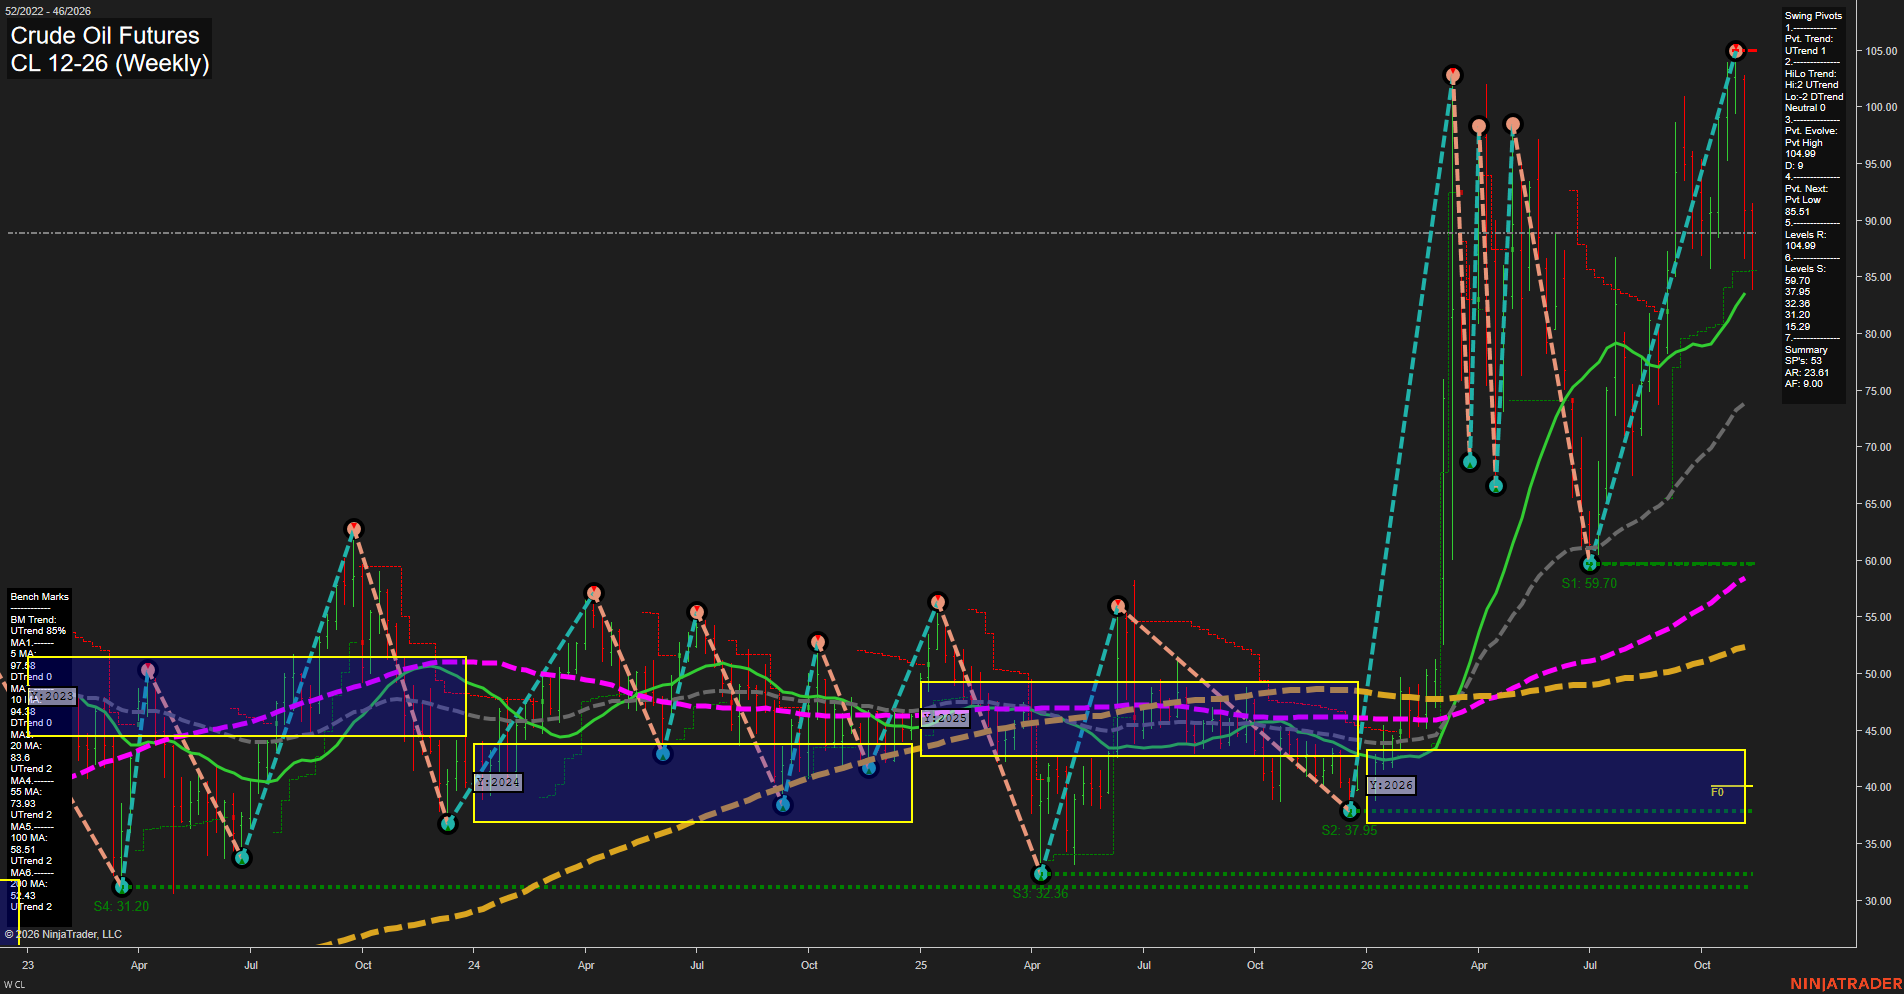
CL Crude Oil Futures Weekly Chart Analysis — Pre-Open: 2026-Nov-14 07:03 CT
Price Action
- Last: Approximately 89.00,
- Bars: Large,
- Mom: Momentum fast to the downside.
WSFG Weekly
- Near-Term
- WSFG Current: -19%
- F0%/NTZ' Bias: Price Below,
- WSFG Trend: Down.
MSFG Month Nov
- Medium-Term
- MSFG Current: -77%
- F0%/NTZ' Bias: Price Below,
- MSFG Trend: Down.
YSFG Year 2026
- Far-Term
- YSFG Current: 153%
- F0%/NTZ' Bias: Price Above,
- YSFG Trend: Up.
Swing Pivots
- (Near-Term) 1. Pvt. Trend: UTrend,
- (Medium-Term) 2. HiLo Trend: Neutral; pivot highs UTrend and pivot lows DTrend,
- 3. Pvt. Evolve: Pvt high 104.99,
- 4. Pvt. Next: Pvt low 85.51,
- 5. Levels R: 104.99,
- 6. Levels S: 59.70, 37.95, 32.36, 31.20, 15.29.
Weekly Benchmarks
- (Near-Term) 5 Week: Approximately 97.2 Down Trend,
- (Near-Term) 10 Week: Approximately 94.2 Down Trend,
- (Medium-Term) 20 Week: 83.60 Up Trend,
- (Medium-Term) 55 Week: 73.93 Up Trend,
- (Far-Term) 100 Week: 58.51 Up Trend,
- (Far-Term) 200 Week: 52.43 Up Trend.
Recent Trade Signals
- 12 Nov 2026: Long CL 12-26 @ 88.93 Signals.USAR.TR120
- 09 Nov 2026: Short CL 12-26 @ 89.45 Signals.USAR-WSFG
Overall Rating
- Near-Term: Bearish,
- Medium-Term: Neutral,
- Far-Term: Bullish.
Key Insights Summary
The weekly chart shows a sharp retracement from 104.99 within a broader bullish price cycle. Large bars and pronounced reversals characterize an unusually volatile, two-way market rather than an orderly trend. Price is below falling 5- and 10-week benchmarks, supporting the bearish near-term assessment despite the retained upward pivot trend and latest TR120 long signal. The opposing recent signals indicate near-term disagreement. Medium-term conditions are mixed, with November’s declining grid and divergent pivot structure offset by rising 20- and 55-week benchmarks beneath price. The 85.51 next-pivot threshold is distinct from confirmed swing support at 59.70. Far-term structure remains bullish, supported by the positive yearly grid and rising 100- and 200-week benchmarks. No medium- or far-term trade signals, news catalysts, or seasonal confirmation are supplied, so those factors cannot independently validate the chart’s outlook.
Chart Analysis ATS AI Generated: 2026-11-14 07:03 for Informational use only, not trading advice. Terms and Risk Disclosure Copyright © 2026. Algo Trading Systems LLC.