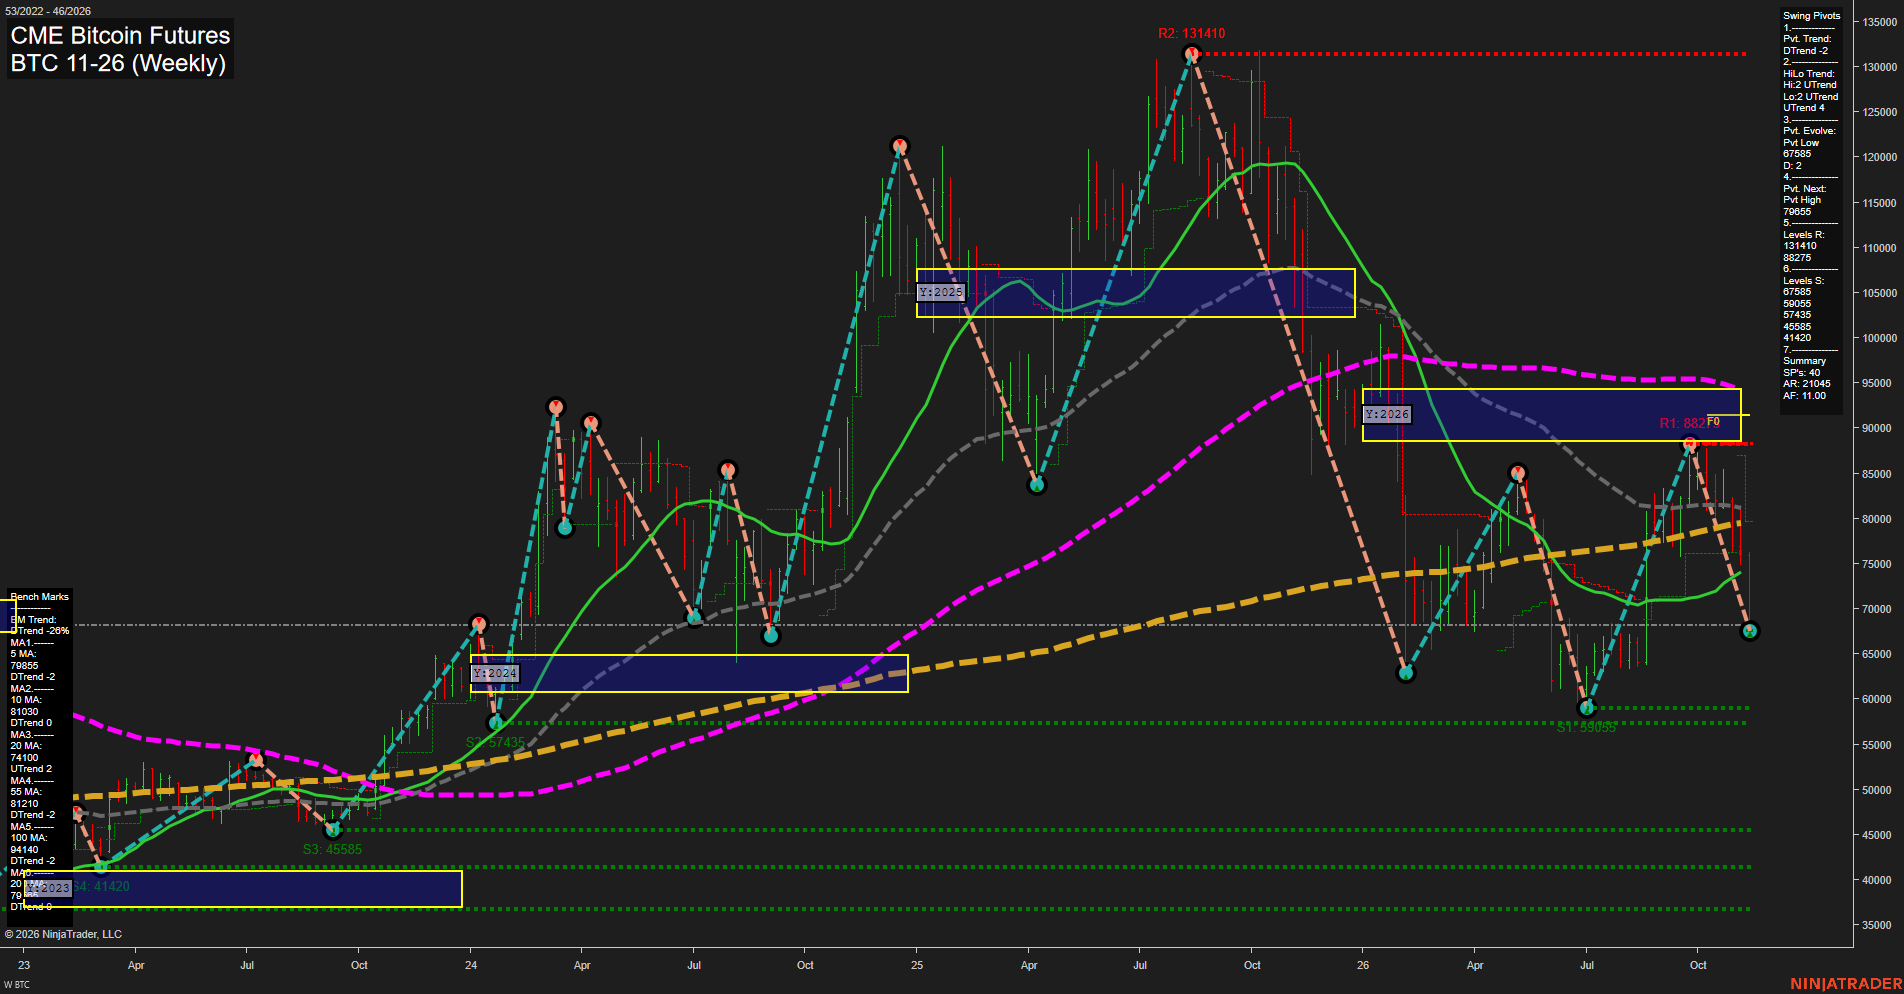
BTC CME Bitcoin Futures Weekly Chart Analysis — Pre-Open: 2026-Nov-14 07:03 CT
Price Action
- Last: Approximately 67,585,
- Bars: Large,
- Mom: Momentum fast.
WSFG Weekly
- Near-Term
- WSFG Current: -176%
- F0%/NTZ' Bias: Price Below,
- WSFG Trend: Down.
MSFG Month Nov
- Medium-Term
- MSFG Current: -76%
- F0%/NTZ' Bias: Price Below,
- MSFG Trend: Down.
YSFG Year 2026
- Far-Term
- YSFG Current: -85%
- F0%/NTZ' Bias: Price Below,
- YSFG Trend: Down.
Swing Pivots
- (Near-Term) 1. Pvt. Trend: DTrend,
- (Medium-Term) 2. HiLo Trend: UTrend,
- 3. Pvt. Evolve: Pvt low 67,585,
- 4. Pvt. Next: Pvt high 79,655,
- 5. Levels R: 131,410, 88,275,
- 6. Levels S: 67,585, 59,055, 57,435, 45,585, 41,420.
Weekly Benchmarks
- (Near-Term) 5 Week: 79,855 Down Trend,
- (Near-Term) 10 Week: 81,030 Down Trend,
- (Medium-Term) 20 Week: 74,100 Up Trend,
- (Medium-Term) 55 Week: 81,210 Down Trend,
- (Far-Term) 100 Week: 94,140 Down Trend,
- (Far-Term) 200 Week: Approximately 79,800 Up Trend.
Recent Trade Signals
- 09 Nov 2026: Short BTC 11-26 @ 74740 Signals.USAR-MSFG
Overall Rating
- Near-Term: Bearish,
- Medium-Term: Bearish,
- Far-Term: Bearish.
Key Insights Summary
From a futures swing perspective, the rejection at 88,275 has developed into a sharp downswing toward the evolving 67,585 pivot low. Large weekly ranges and fast downside momentum indicate renewed selling rather than orderly consolidation. Price is below all six benchmarks and every session grid remains bearish. The medium-term HiLo UTrend and rising 20-week benchmark are counterpoints, but neither outweighs the current downside alignment. The 67,585 level is evolving support rather than a confirmed reversal; lower established supports are 59,055 and 57,435. The next-pivot reversal reference is 79,655, near the overhead benchmark cluster around 79,800–81,210, while 88,275 remains swing resistance. The supplied monthly short signal reinforces the bearish medium-term reading. No separate TR120, WSFG or TR720 signals are identifiable in the image, and news or seasonal explanations cannot be established from this chart alone.
Chart Analysis ATS AI Generated: 2026-11-14 07:03 for Informational use only, not trading advice. Terms and Risk Disclosure Copyright © 2026. Algo Trading Systems LLC.