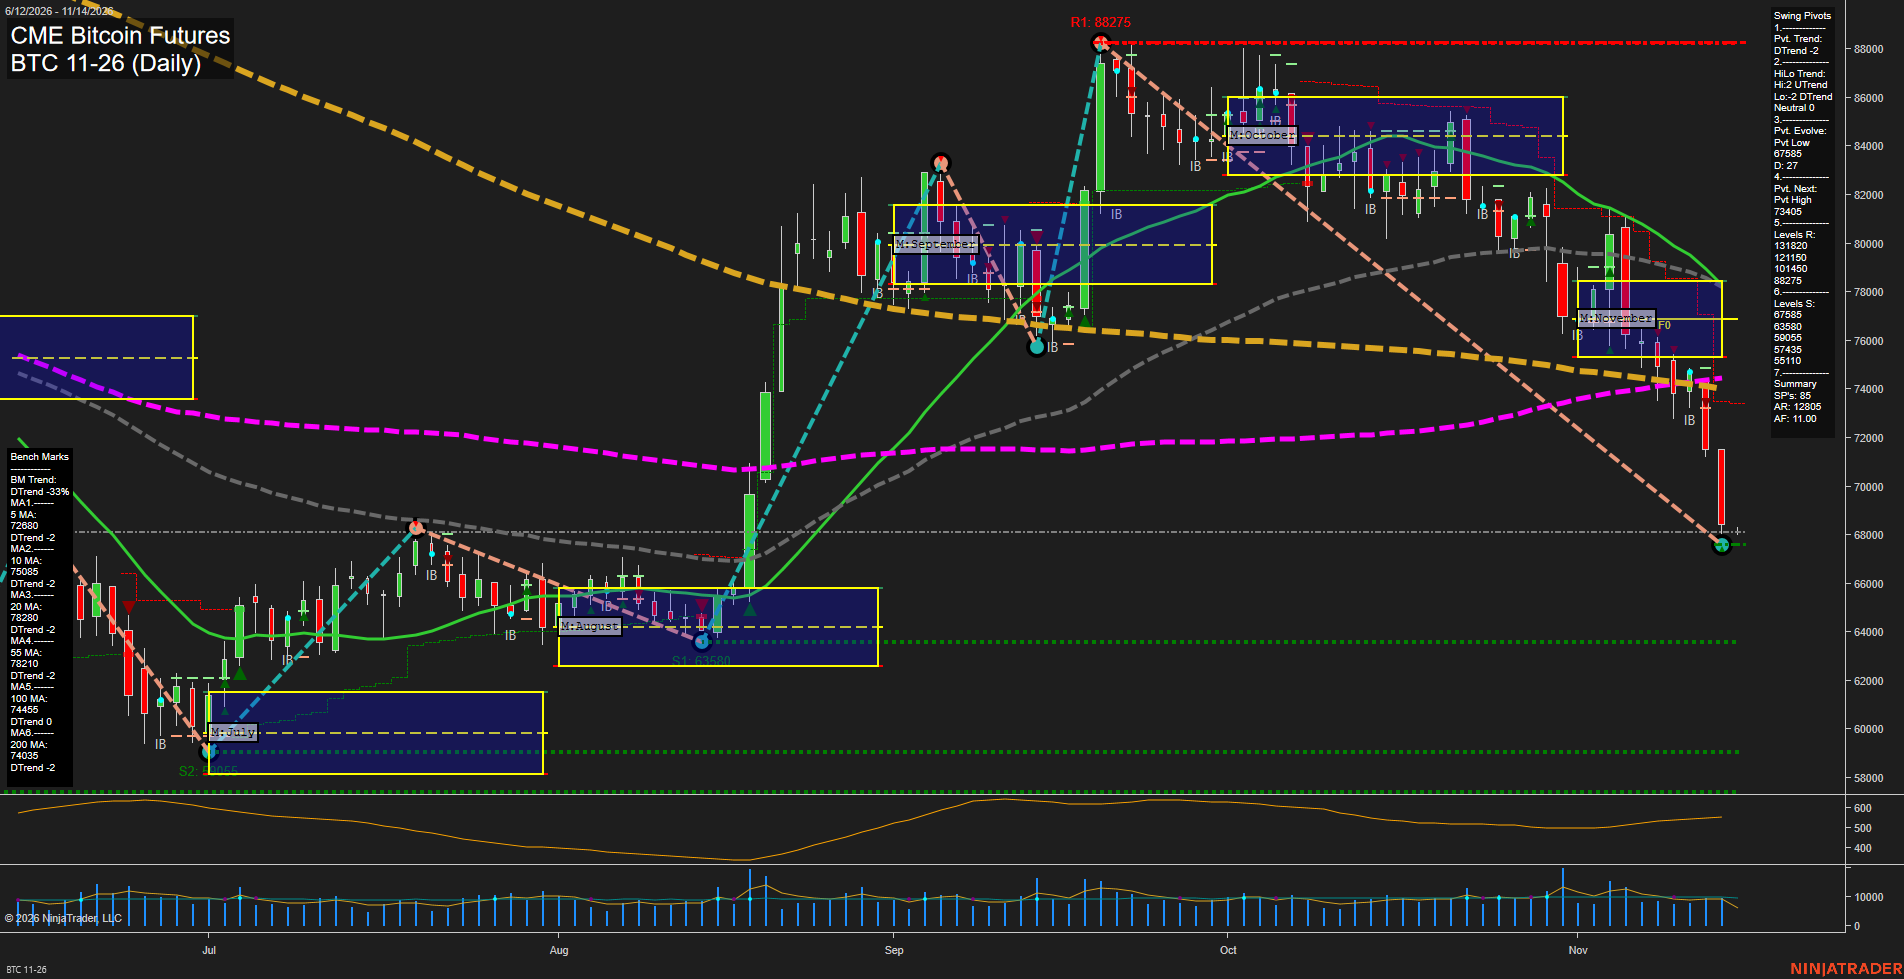
BTC CME Bitcoin Futures Daily Chart Analysis — Pre-Open: 2026-Nov-14 07:02 CT
Price Action
- Last: Approximately 68000,
- Bars: Large,
- Mom: Momentum fast.
WSFG Weekly
- Near-Term
- WSFG Current: -176%
- F0%/NTZ' Bias: Price Below,
- WSFG Trend: Down.
MSFG Month Nov
- Medium-Term
- MSFG Current: -76%
- F0%/NTZ' Bias: Price Below,
- MSFG Trend: Down.
YSFG Year 2026
- Far-Term
- YSFG Current: -85%
- F0%/NTZ' Bias: Price Below,
- YSFG Trend: Down.
Swing Pivots
- (Near-Term) 1. Pvt. Trend: DTrend,
- (Medium-Term) 2. HiLo Trend: Neutral, higher highs and lower lows,
- 3. Pvt. Evolve: Pvt low 67585,
- 4. Pvt. Next: Pvt high 73405,
- 5. Levels R: 131820, 121150, 101450, 88275,
- 6. Levels S: 67585, 63580, 59055, 57435, 55110.
Daily Benchmarks
- (Near-Term) 5 Day: 72680 Down Trend,
- (Near-Term) 10 Day: 75085 Down Trend,
- (Medium-Term) 20 Day: 78280 Down Trend,
- (Medium-Term) 55 Day: 78210 Down Trend,
- (Far-Term) 100 Day: 74455 Down Trend, flat slope reading,
- (Far-Term) 200 Day: 74035 Down Trend.
Additional Metrics
Recent Trade Signals
- 09 Nov 2026: Short BTC 11-26 @ 74740 Signals.USAR-MSFG
Overall Rating
- Near-Term: Bearish,
- Medium-Term: Bearish,
- Far-Term: Bearish.
Key Insights Summary
From a futures swing trader’s perspective, the dominant feature is accelerating downside continuation after rejection from November’s monthly trading zone. Large red candles have carried price below every benchmark average and toward the evolving 67585 pivot low. The decline from 88275 has substantially retraced the prior summer rally; 63580 is the next listed support below that evolving low. Weekly, monthly and yearly grid readings align bearishly, while the medium-term HiLo structure remains mixed rather than a confirmed uniform downtrend. The 73405 opposite-pivot threshold and overhead benchmark cluster frame the distance required for meaningful structural improvement. Recent price expansion contrasts with relatively ordinary volume, so the chart does not independently establish capitulation. No news or seasonal catalyst can be verified from the image.
Chart Analysis ATS AI Generated: 2026-11-14 07:03 for Informational use only, not trading advice. Terms and Risk Disclosure Copyright © 2026. Algo Trading Systems LLC.