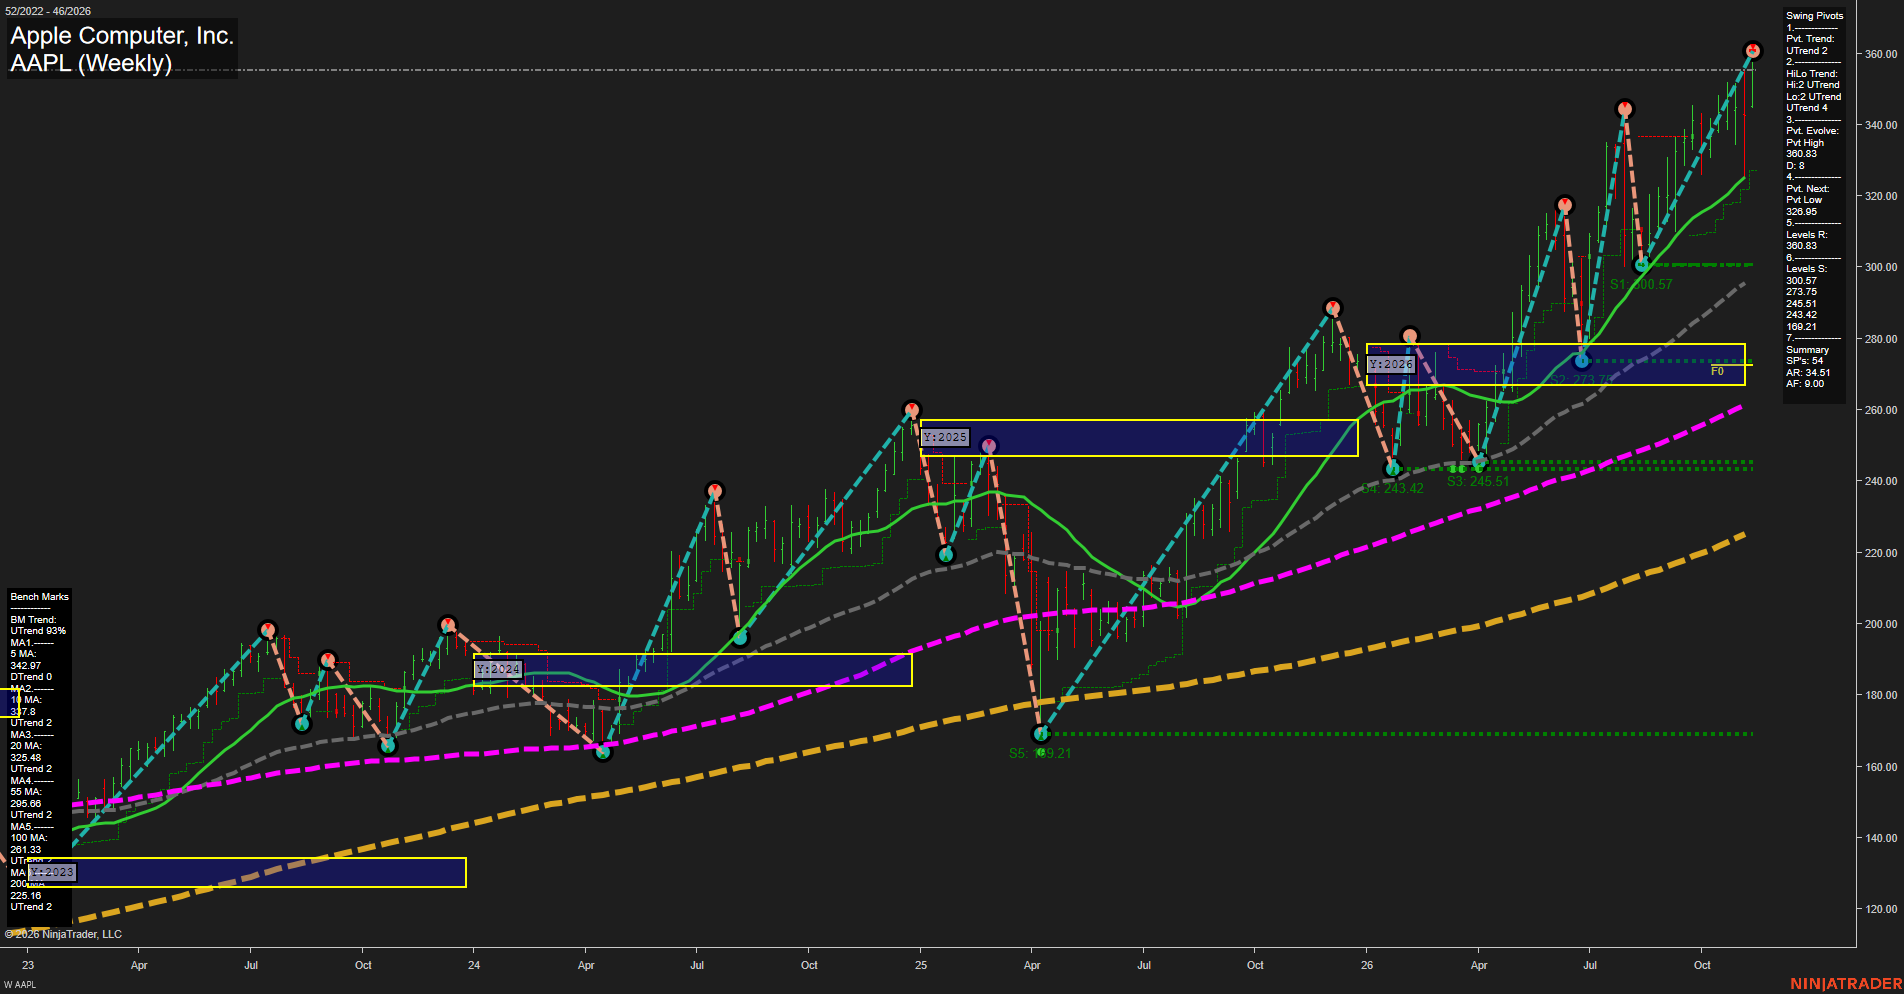
AAPL Apple Computer; Inc. Weekly Chart Analysis — Pre-Open: 2026-Nov-14 07:02 CT
Price Action
- Last: Approximately 356,
- Bars: Large,
- Mom: Momentum fast.
WSFG Weekly
- Near-Term
- WSFG Current: NA%
- F0%/NTZ' Bias: Price Neutral,
- WSFG Trend: Neutral.
MSFG Month Nov
- Medium-Term
- MSFG Current: NA%
- F0%/NTZ' Bias: Price Neutral,
- MSFG Trend: Neutral.
YSFG Year 2026
- Far-Term
- YSFG Current: NA%
- F0%/NTZ' Bias: Price above F0% and NTZ,
- YSFG Trend: Bullish.
Swing Pivots
- (Near-Term) 1. Pvt. Trend: UTrend,
- (Medium-Term) 2. HiLo Trend: UTrend,
- 3. Pvt. Evolve: Pvt high 360.83,
- 4. Pvt. Next: Pvt low 328.95,
- 5. Levels R: 360.83,
- 6. Levels S: 300.57, 273.75, 245.51, 243.42, 169.21.
Weekly Benchmarks
- (Near-Term) 5 Week: 342.97 Down Trend,
- (Near-Term) 10 Week: 337.8 Up Trend,
- (Medium-Term) 20 Week: 325.48 Up Trend,
- (Medium-Term) 55 Week: 295.66 Up Trend,
- (Far-Term) 100 Week: 261.33 Up Trend,
- (Far-Term) 200 Week: 225.16 Up Trend.
Overall Rating
- Near-Term: Bullish,
- Medium-Term: Bullish,
- Far-Term: Bullish.
Key Insights Summary
From a futures swing trader’s perspective, this equity chart shows broad trend alignment rather than a range-bound market. Higher swing highs and lows, price above all six benchmarks, and a strong rebound from 300.57 support a bullish continuation structure. The evolving high at 360.83 is the immediate resistance reference; 328.95 is the displayed opposite-pivot reversal threshold, not a confirmed support pivot. The declining five-week benchmark introduces a near-term divergence, while the rising longer benchmarks reinforce the broader advance. Price is substantially above the 2026 yearly neutral zone near 267–278, indicating an extended bullish phase with historically wide countertrend swings. Weekly and monthly grids and the requested recent signal studies are not displayed, so their direction cannot be verified; their neutral entries are placeholders rather than observed readings. News and seasonal drivers cannot be established from this chart alone.
Chart Analysis ATS AI Generated: 2026-11-14 07:02 for Informational use only, not trading advice. Terms and Risk Disclosure Copyright © 2026. Algo Trading Systems LLC.