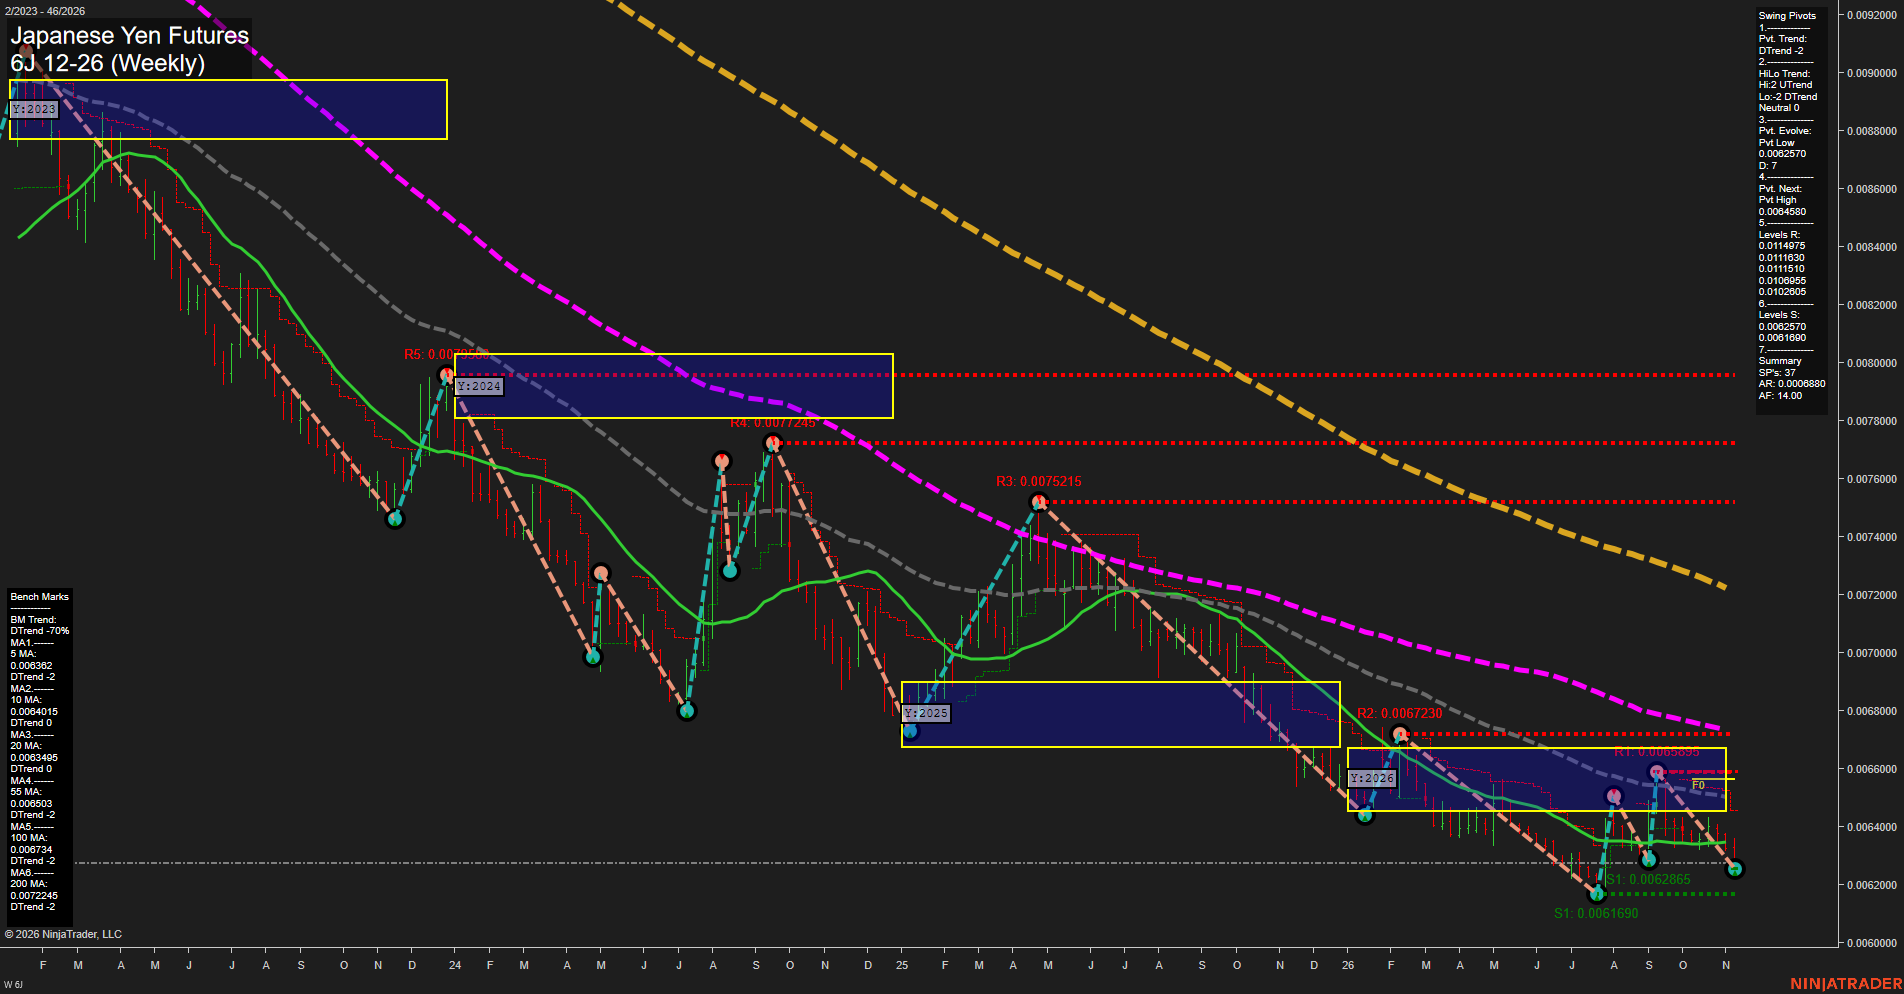
6J Japanese Yen Futures Weekly Chart Analysis — Pre-Open: 2026-Nov-14 07:01 CT
Price Action
- Last: Approximately 0.0062800,
- Bars: Small,
- Mom: Momentum slow.
WSFG Weekly
- Near-Term
- WSFG Current: -73%
- F0%/NTZ' Bias: Price Below,
- WSFG Trend: Down.
MSFG Month Nov
- Medium-Term
- MSFG Current: -43%
- F0%/NTZ' Bias: Price Below,
- MSFG Trend: Down.
YSFG Year 2026
- Far-Term
- YSFG Current: -26%
- F0%/NTZ' Bias: Price Below,
- YSFG Trend: Down.
Swing Pivots
- (Near-Term) 1. Pvt. Trend: DTrend,
- (Medium-Term) 2. HiLo Trend: Neutral,
- 3. Pvt. Evolve: Pvt low 0.0062570,
- 4. Pvt. Next: Pvt high 0.0064580,
- 5. Levels R: 0.0114975, 0.0111630, 0.0111510, 0.0106955, 0.0102805,
- 6. Levels S: 0.0062570, 0.0061690.
Weekly Benchmarks
- (Near-Term) 5 Week: 0.0063862 Down Trend,
- (Near-Term) 10 Week: 0.0064015 Down Trend,
- (Medium-Term) 20 Week: 0.0063495 Down Trend,
- (Medium-Term) 55 Week: 0.0065503 Down Trend,
- (Far-Term) 100 Week: 0.0067340 Down Trend,
- (Far-Term) 200 Week: 0.0072245 Down Trend.
Recent Trade Signals
- 10 Nov 2026: Short 6J 12-26 @ 0.0063185 Signals.USAR-WSFG
- 10 Nov 2026: Short 6J 12-26 @ 0.0063185 Signals.USAR.TR120
Overall Rating
- Near-Term: Bearish,
- Medium-Term: Bearish,
- Far-Term: Bearish.
Key Insights Summary
The weekly structure remains bearish, with price below all six benchmarks and all three session grids pointing down. The latest decline has reversed the recent rebound and is testing the evolving 0.0062570 pivot low; 0.0061690 is the next displayed support. Small weekly bars indicate a grinding decline rather than an accelerating selloff. The HiLo summary is neutral because rising pivot highs conflict with falling pivot lows, but the broader medium-term evidence remains bearish. The 0.0064580 next-pivot threshold marks the chart's near-term structural reversal reference. Resistance values in the Swing Pivots summary appear inconsistent with the plotted resistance labels; the nearest plotted resistance is 0.0065895. Both supplied November short signals align with the prevailing near-term trend. News and seasonal influences cannot be established from this chart alone.
Chart Analysis ATS AI Generated: 2026-11-14 07:01 for Informational use only, not trading advice. Terms and Risk Disclosure Copyright © 2026. Algo Trading Systems LLC.