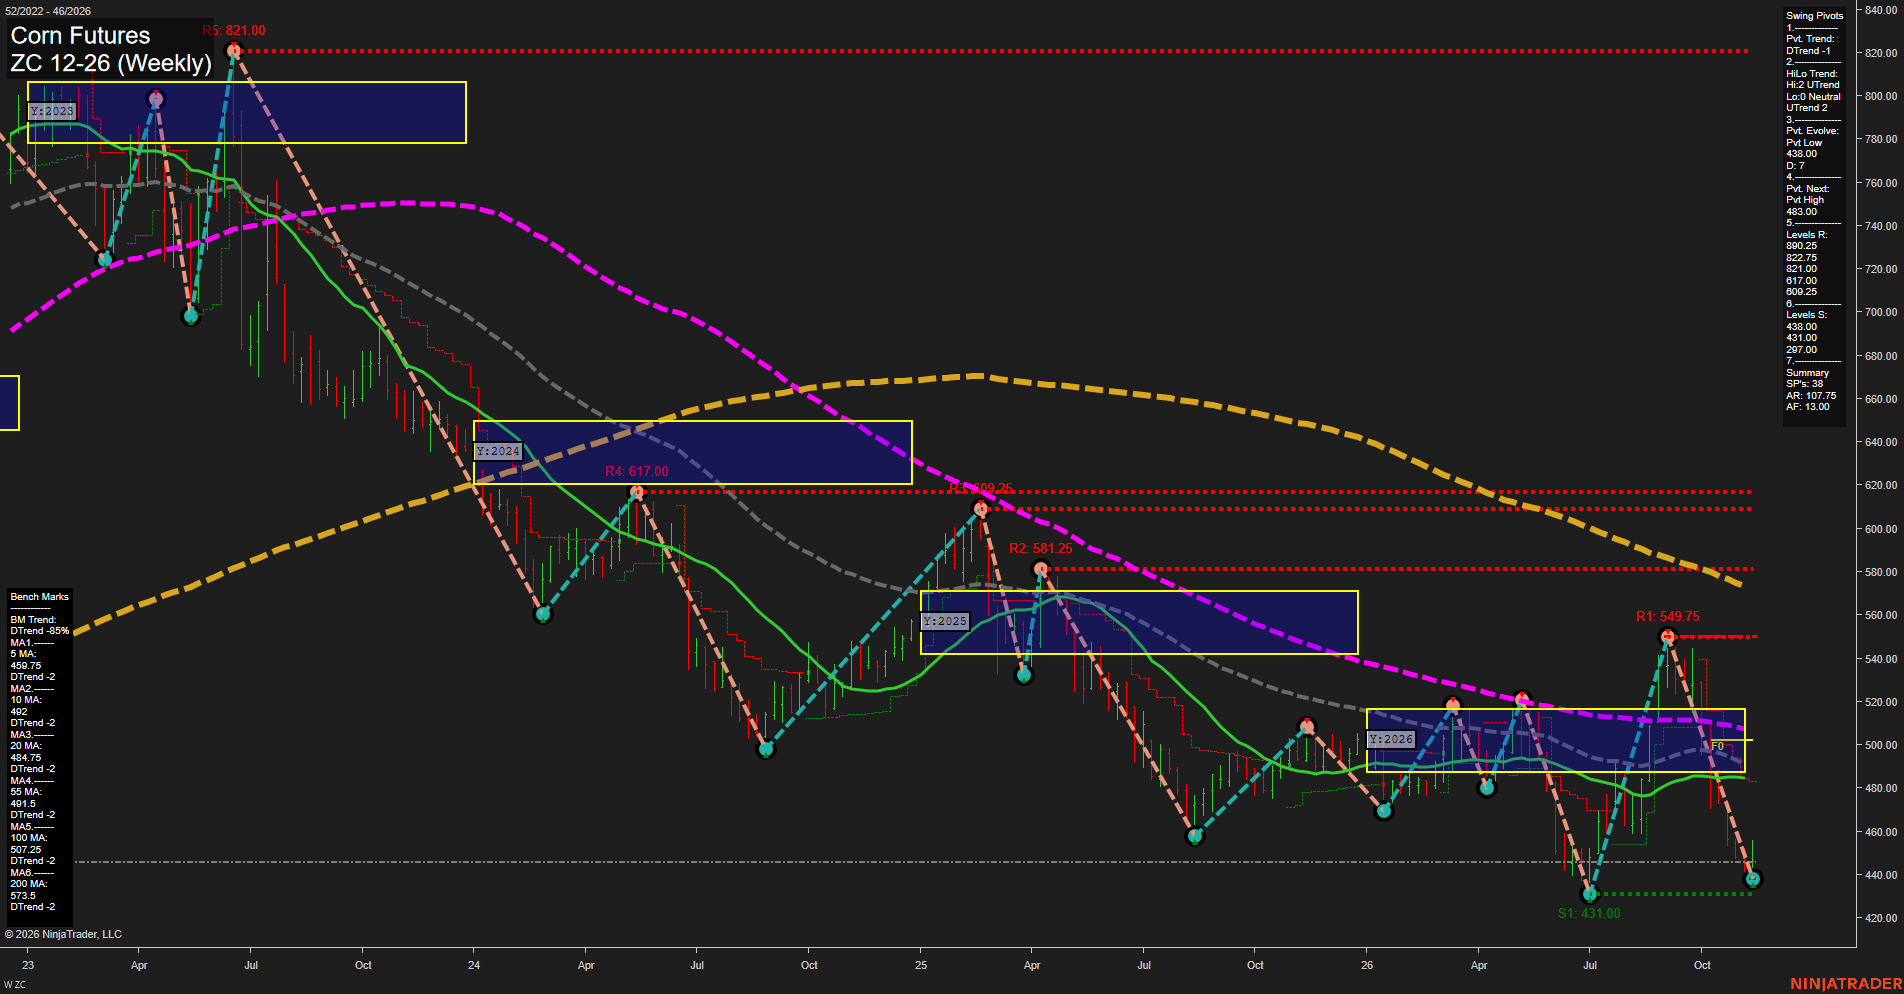
ZC Corn Futures Weekly Chart Analysis — After Market Close: 2026-Nov-13 15:15 CT
Price Action
- Last: Approximately 446.00,
- Bars: Large,
- Mom: Momentum fast.
WSFG Weekly
- Near-Term
- WSFG Current: 31%
- F0%/NTZ' Bias: Price Above,
- WSFG Trend: Up.
MSFG Month Nov
- Medium-Term
- MSFG Current: -3%
- F0%/NTZ' Bias: Price Below,
- MSFG Trend: Down.
YSFG Year 2026
- Far-Term
- YSFG Current: -38%
- F0%/NTZ' Bias: Price Below,
- YSFG Trend: Down.
Swing Pivots
- (Near-Term) 1. Pvt. Trend: DTrend,
- (Medium-Term) 2. HiLo Trend: UTrend,
- 3. Pvt. Evolve: Pvt low 438.00,
- 4. Pvt. Next: Pvt high 483.00,
- 5. Levels R: 890.25, 822.75, 821.00, 617.00, 609.25,
- 6. Levels S: 438.00, 431.00, 297.00.
Weekly Benchmarks
- (Near-Term) 5 Week: 459.75 Down Trend,
- (Near-Term) 10 Week: 492.00 Down Trend,
- (Medium-Term) 20 Week: 484.75 Down Trend,
- (Medium-Term) 55 Week: 491.50 Down Trend,
- (Far-Term) 100 Week: 507.25 Down Trend,
- (Far-Term) 200 Week: 573.50 Down Trend.
Recent Trade Signals
- 10 Nov 2026: Short ZC 12-26 @ 440.75 Signals.USAR-MSFG
- 09 Nov 2026: Short ZC 12-26 @ 439.25 Signals.USAR-WSFG
Overall Rating
- Near-Term: Bearish,
- Medium-Term: Bearish,
- Far-Term: Bearish.
Key Insights Summary
The sharp reversal from the 549.75 swing high has carried corn below all six declining weekly benchmarks and beneath the yearly neutral zone. Large recent weekly ranges indicate strong downside momentum, although the latest recovery from 438.00 and positive weekly grid suggest a near-term countertrend bounce. The evolving 438.00 pivot low remains above 431.00, consistent with the summary’s medium-term HiLo UTrend, but that constructive divergence is outweighed by falling benchmarks, the negative monthly grid and recent short signals. The 438.00–431.00 area defines the immediate support test; 459.75 is the nearest benchmark overhead, followed by the 483.00 pivot-reversal threshold and the 484.75–492.00 benchmark cluster. Overall, this is a bearish swing phase within a broader multiyear decline rather than a confirmed bullish reversal. The image alone does not establish a news-driven or seasonal explanation.
Chart Analysis ATS AI Generated: 2026-11-13 15:16 for Informational use only, not trading advice. Terms and Risk Disclosure Copyright © 2026. Algo Trading Systems LLC.