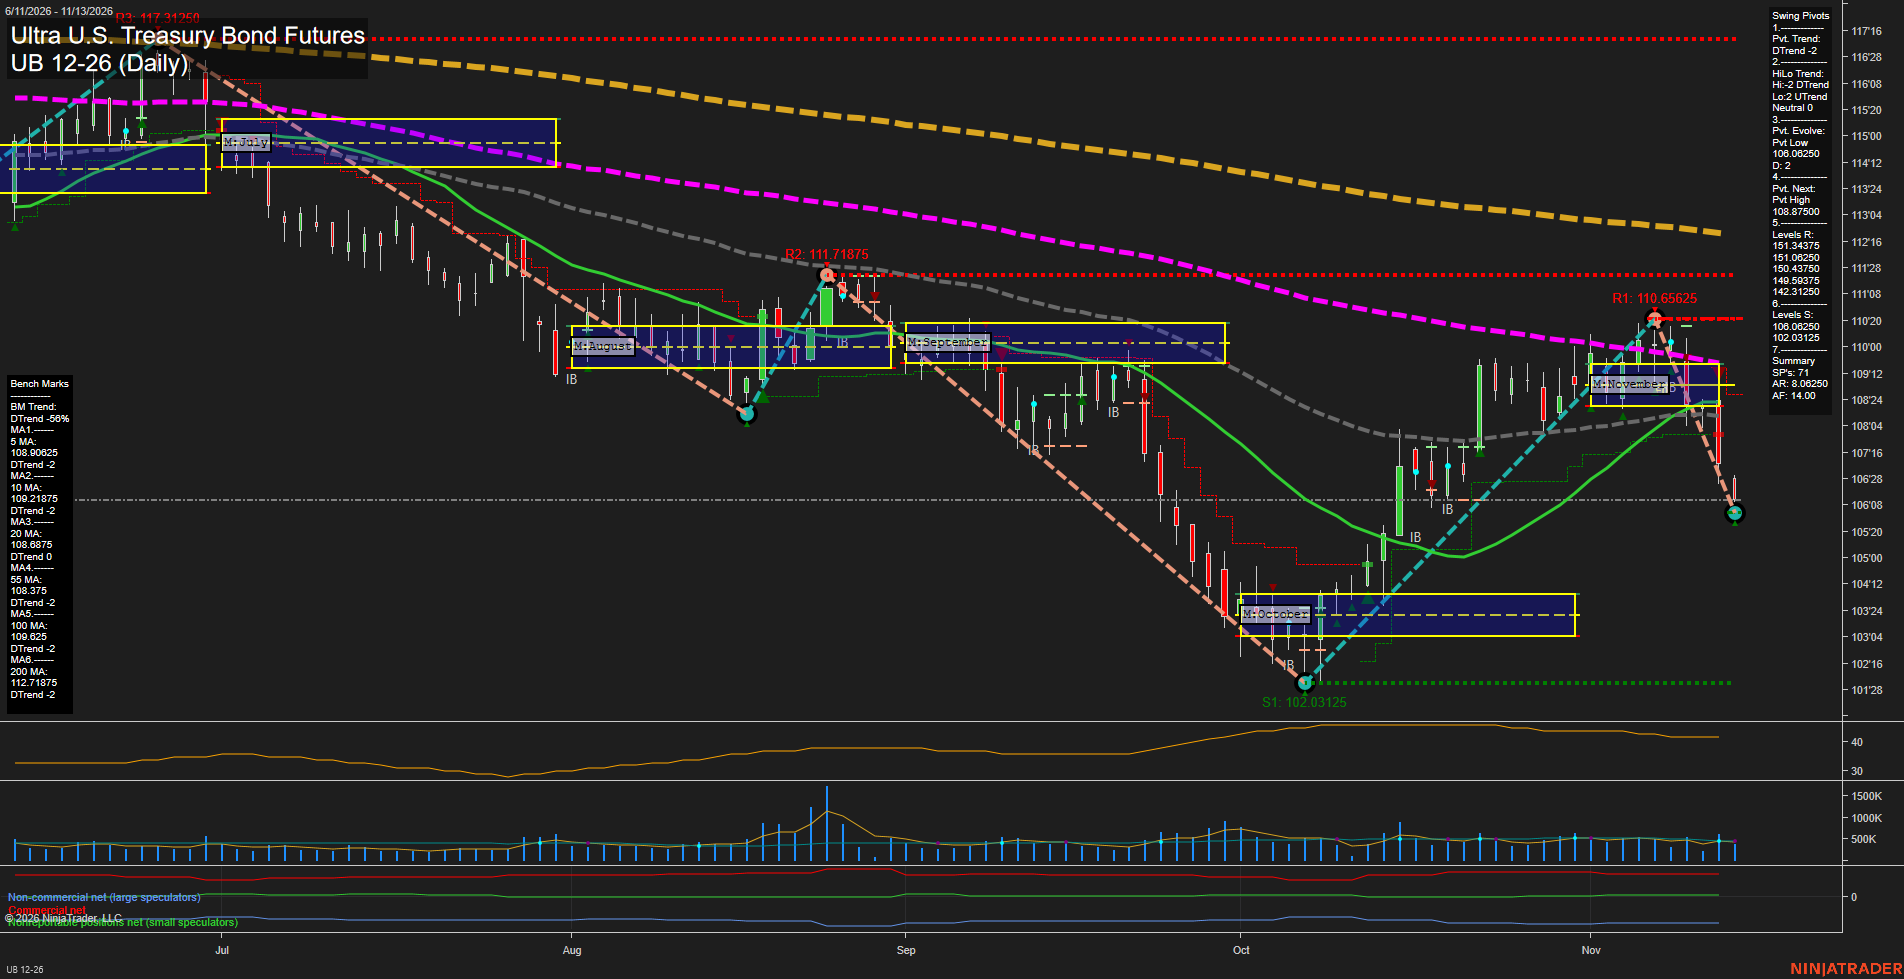
UB Ultra U.S. Treasury Bond Futures Daily Chart Analysis — After Market Close: 2026-Nov-13 15:13 CT
Price Action
- Last: Approximately 106.375,
- Bars: Large,
- Mom: Momentum fast.
WSFG Weekly
- Near-Term
- WSFG Current: -116%
- F0%/NTZ' Bias: Price Below,
- WSFG Trend: Down.
MSFG Month Nov
- Medium-Term
- MSFG Current: -47%
- F0%/NTZ' Bias: Price Below,
- MSFG Trend: Down.
YSFG Year 2026
- Far-Term
- YSFG Current: -32%
- F0%/NTZ' Bias: Price Below,
- YSFG Trend: Down.
Swing Pivots
- (Near-Term) 1. Pvt. Trend: DTrend,
- (Medium-Term) 2. HiLo Trend: Neutral; high pivots DTrend, low pivots UTrend,
- 3. Pvt. Evolve: Pvt low 106.06250,
- 4. Pvt. Next: Pvt high 108.87500,
- 5. Levels R: 151.34375, 151.06250, 150.43750, 149.59375, 142.31250,
- 6. Levels S: 106.06250, 102.03125.
Daily Benchmarks
- (Near-Term) 5 Day: 108.90625 Down Trend,
- (Near-Term) 10 Day: 109.21875 Down Trend,
- (Medium-Term) 20 Day: 108.6875 Down Trend,
- (Medium-Term) 55 Day: 108.375 Down Trend,
- (Far-Term) 100 Day: 109.625 Down Trend,
- (Far-Term) 200 Day: 112.71875 Down Trend.
Additional Metrics
Recent Trade Signals
- 12 Nov 2026: Short UB 12-26 @ 107.25 Signals.USAR.TR720
- 12 Nov 2026: Short UB 12-26 @ 108.5 Signals.USAR-MSFG
- 10 Nov 2026: Short UB 12-26 @ 108.6875 Signals.USAR.TR120
Overall Rating
- Near-Term: Bearish,
- Medium-Term: Bearish,
- Far-Term: Bearish.
Key Insights Summary
The October recovery has reversed sharply after forming a lower swing high at 110.65625 versus August’s 111.71875. Large recent downside bars, a developing pivot low at 106.06250, and price below every benchmark characterize a fast bearish swing. Weekly, monthly and yearly grids reinforce that weakness, while the supplied short signals align across time horizons. Medium-term pivot structure remains mixed rather than uniformly bearish because the current low still exceeds October’s 102.03125 low. The November consolidation and moving-average cluster around 108.375–109.625 now sit overhead. The summary’s resistance values are inconsistent with the displayed price scale; visible chart resistance is 117.31250, 111.71875 and 110.65625. No specific news or seasonal catalyst can be established from this chart alone.
Chart Analysis ATS AI Generated: 2026-11-13 15:14 for Informational use only, not trading advice. Terms and Risk Disclosure Copyright © 2026. Algo Trading Systems LLC.