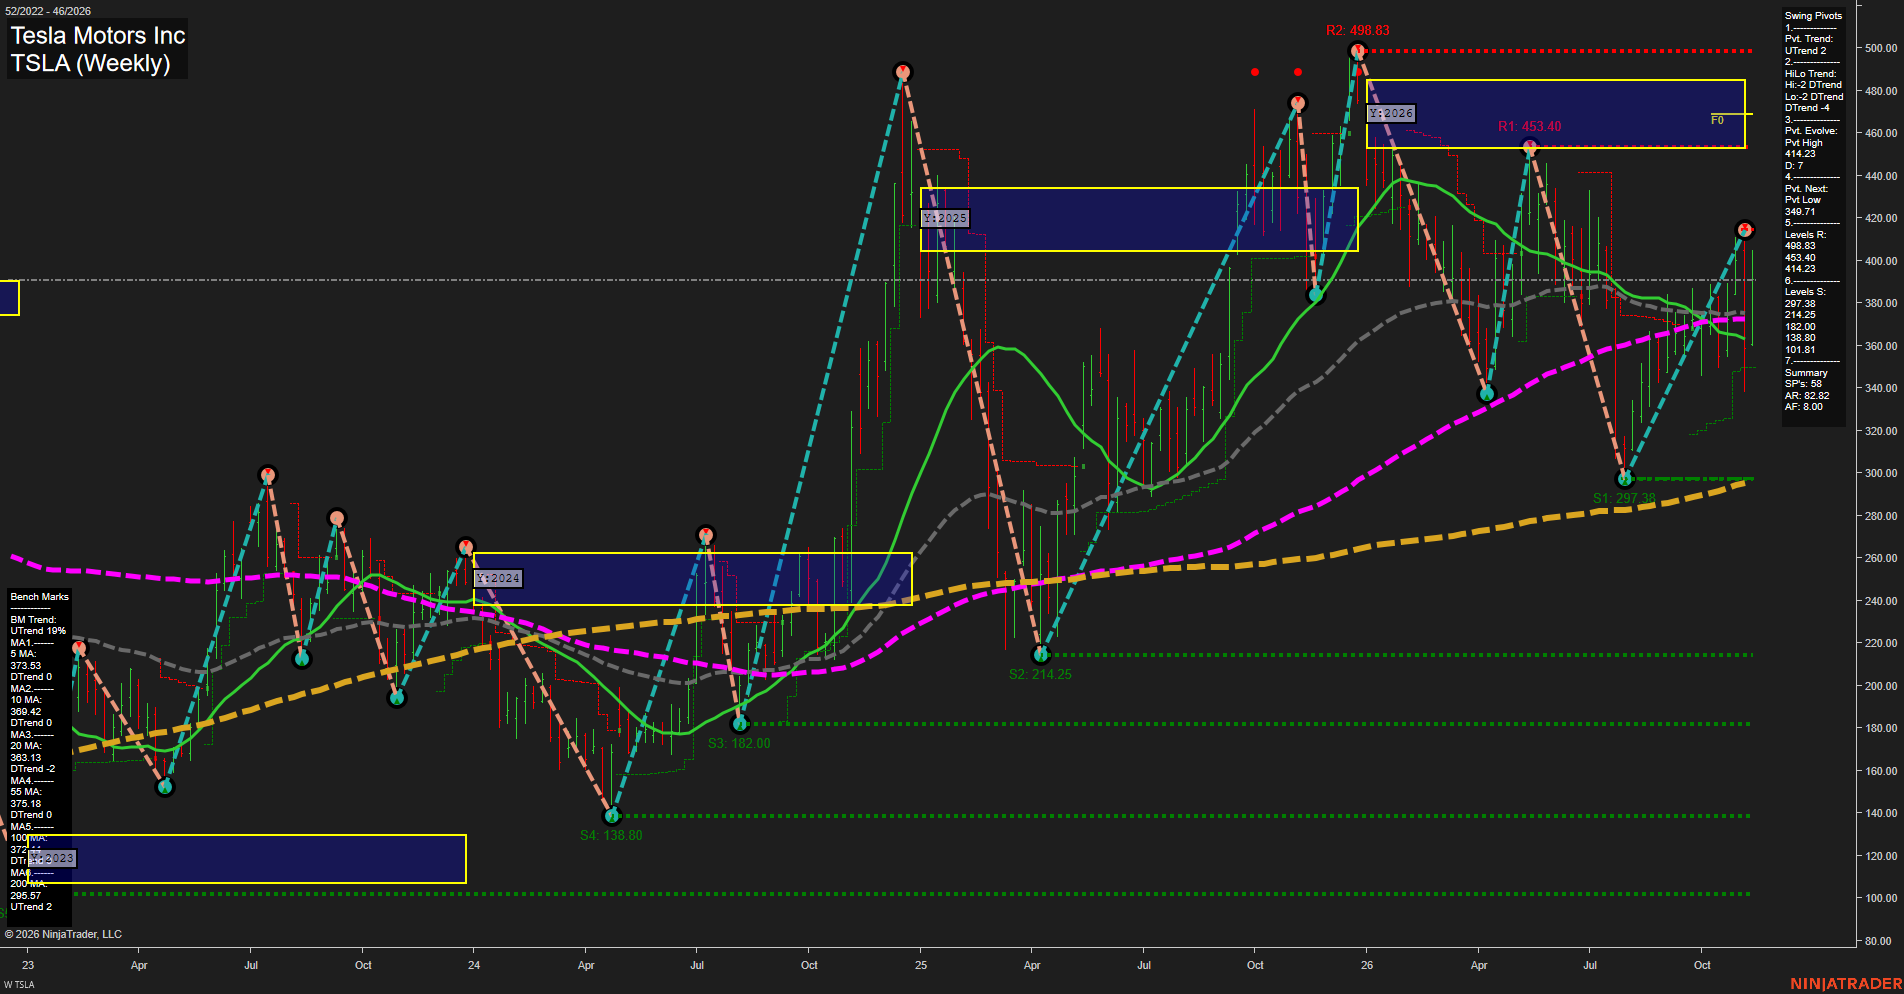
TSLA Tesla Motors Inc Weekly Chart Analysis — After Market Close: 2026-Nov-13 15:13 CT
Price Action
- Last: Approximately 391,
- Bars: Large,
- Mom: Momentum fast.
WSFG Weekly
- Near-Term
- WSFG Current: NA%
- F0%/NTZ' Bias: Price Neutral,
- WSFG Trend: Neutral.
MSFG Month Nov
- Medium-Term
- MSFG Current: NA%
- F0%/NTZ' Bias: Price Neutral,
- MSFG Trend: Neutral.
YSFG Year 2026
- Far-Term
- YSFG Current: NA%
- F0%/NTZ' Bias: Price Below NTZ,
- YSFG Trend: Bearish.
Swing Pivots
- (Near-Term) 1. Pvt. Trend: UTrend,
- (Medium-Term) 2. HiLo Trend: DTrend,
- 3. Pvt. Evolve: Pvt high 414.23,
- 4. Pvt. Next: Pvt low 349.71,
- 5. Levels R: 498.83, 453.40, 414.23,
- 6. Levels S: 297.38, 214.25, 182.00, 138.80, 101.81.
Weekly Benchmarks
- (Near-Term) 5 Week: 373.53 Down Trend,
- (Near-Term) 10 Week: 369.42 Down Trend,
- (Medium-Term) 20 Week: 363.13 Down Trend,
- (Medium-Term) 55 Week: 375.18 Down Trend,
- (Far-Term) 100 Week: Approximately 372.44 Down Trend,
- (Far-Term) 200 Week: 295.57 Up Trend.
Overall Rating
- Near-Term: Neutral,
- Medium-Term: Bearish,
- Far-Term: Neutral.
Key Insights Summary
From a futures swing trader’s perspective, TSLA shows a fast countertrend recovery from 297.38 toward the evolving 414.23 pivot high, within a broader sequence of lower swing highs and lower lows. Price has recovered above the clustered weekly benchmarks around 363–375, but most benchmark slopes remain negative, creating mixed near-term conditions rather than confirmed trend alignment. The 414.23 level marks immediate resistance, followed by 453.40 and 498.83; 349.71 is the summary’s next-pivot reversal threshold, distinct from confirmed support at 297.38. Price remains below the 2026 yearly neutral zone, approximately 453–485, while the rising 200-week benchmark preserves a constructive major-trend component. Wide weekly ranges indicate substantial volatility. Weekly and monthly grids and the specified recent signal studies are not visible, so their neutral entries represent unavailable confirmation. This is an equity chart viewed through a futures-style swing framework; futures-specific volume, open interest, and basis are not shown, and news or seasonal drivers cannot be established from this image.
Chart Analysis ATS AI Generated: 2026-11-13 15:13 for Informational use only, not trading advice. Terms and Risk Disclosure Copyright © 2026. Algo Trading Systems LLC.