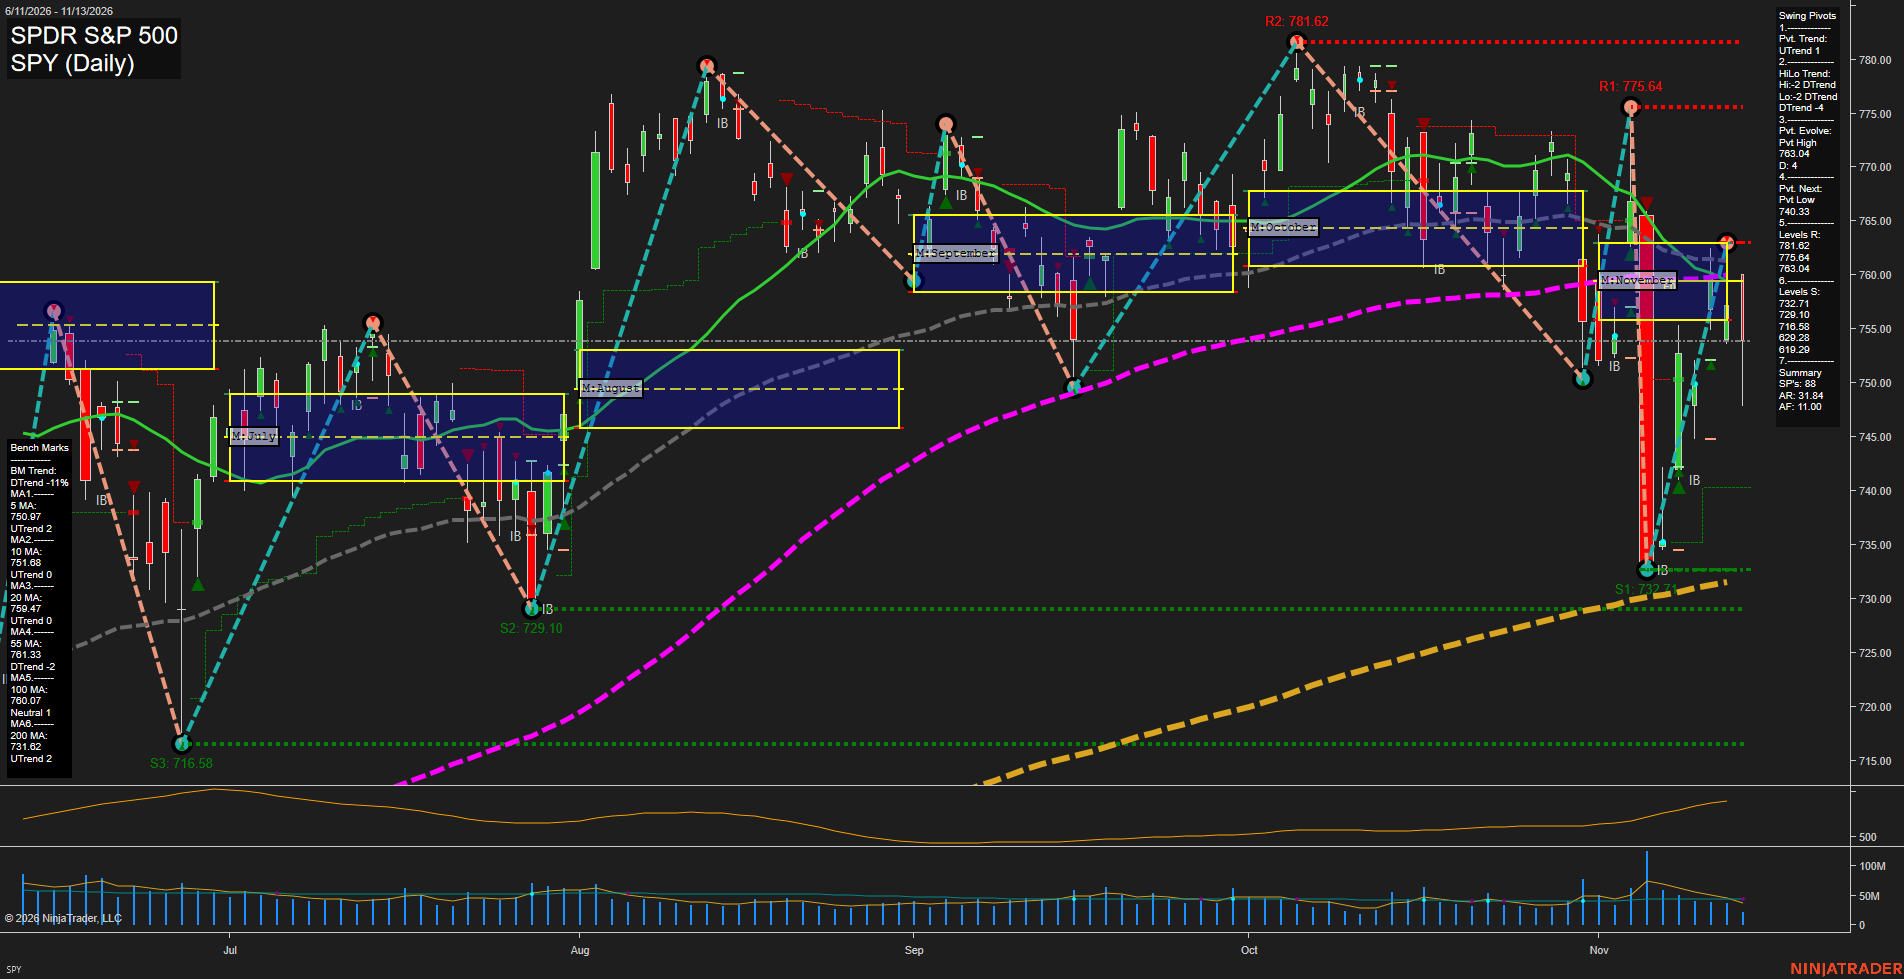
SPY SPDR S&P 500 Daily Chart Analysis — After Market Close: 2026-Nov-13 15:12 CT
Price Action
- Last: Approximately 754.00,
- Bars: Large,
- Mom: Momentum fast.
WSFG Weekly
- Near-Term
- WSFG Current: NA%
- F0%/NTZ' Bias: Price Neutral,
- WSFG Trend: Neutral.
MSFG Month Nov
- Medium-Term
- MSFG Current: NA%
- F0%/NTZ' Bias: Price Bearish,
- MSFG Trend: Bearish.
YSFG Year 2026
- Far-Term
- YSFG Current: NA%
- F0%/NTZ' Bias: Price Neutral,
- YSFG Trend: Neutral.
Swing Pivots
- (Near-Term) 1. Pvt. Trend: UTrend,
- (Medium-Term) 2. HiLo Trend: DTrend,
- 3. Pvt. Evolve: Pvt high 763.04,
- 4. Pvt. Next: Pvt low 740.33,
- 5. Levels R: 781.62, 775.64, 763.04,
- 6. Levels S: 732.71, 729.10, 716.58, 629.28, 619.29.
Daily Benchmarks
- (Near-Term) 5 Day: 750.97 Up Trend,
- (Near-Term) 10 Day: 751.68 Up Trend,
- (Medium-Term) 20 Day: 759.47 Up Trend,
- (Medium-Term) 55 Day: 761.33 Down Trend,
- (Far-Term) 100 Day: 760.07 Neutral,
- (Far-Term) 200 Day: 731.62 Up Trend.
Additional Metrics
- ATR: 564,
- VOLMA: 47470907.
Overall Rating
- Near-Term: Bullish,
- Medium-Term: Bearish,
- Far-Term: Neutral.
Key Insights Summary
From a futures swing trader’s perspective, SPY shows a near-term recovery within a broader corrective structure, rather than a confirmed trend continuation. The rebound from 732.71 produced an evolving pivot high at 763.04, but the latest large-range reversal returned price below November’s neutral zone and the clustered 20-, 55- and 100-day benchmarks near 759–761. Short-term averages and the current pivot trend remain positive, while lower medium-term pivot highs and lows retain a bearish backdrop. Rising ATR and November’s sharp two-way swings characterize an expanded-volatility, whipsaw-prone regime. The 732.71 support sits close to the rising 200-day average at 731.62, with 729.10 beneath it. These are SPY reference prices, not executable futures levels. Weekly and yearly grids, named strategy signals, and news catalysts are not visible; their direction cannot be independently established from this image.
Chart Analysis ATS AI Generated: 2026-11-13 15:12 for Informational use only, not trading advice. Terms and Risk Disclosure Copyright © 2026. Algo Trading Systems LLC.