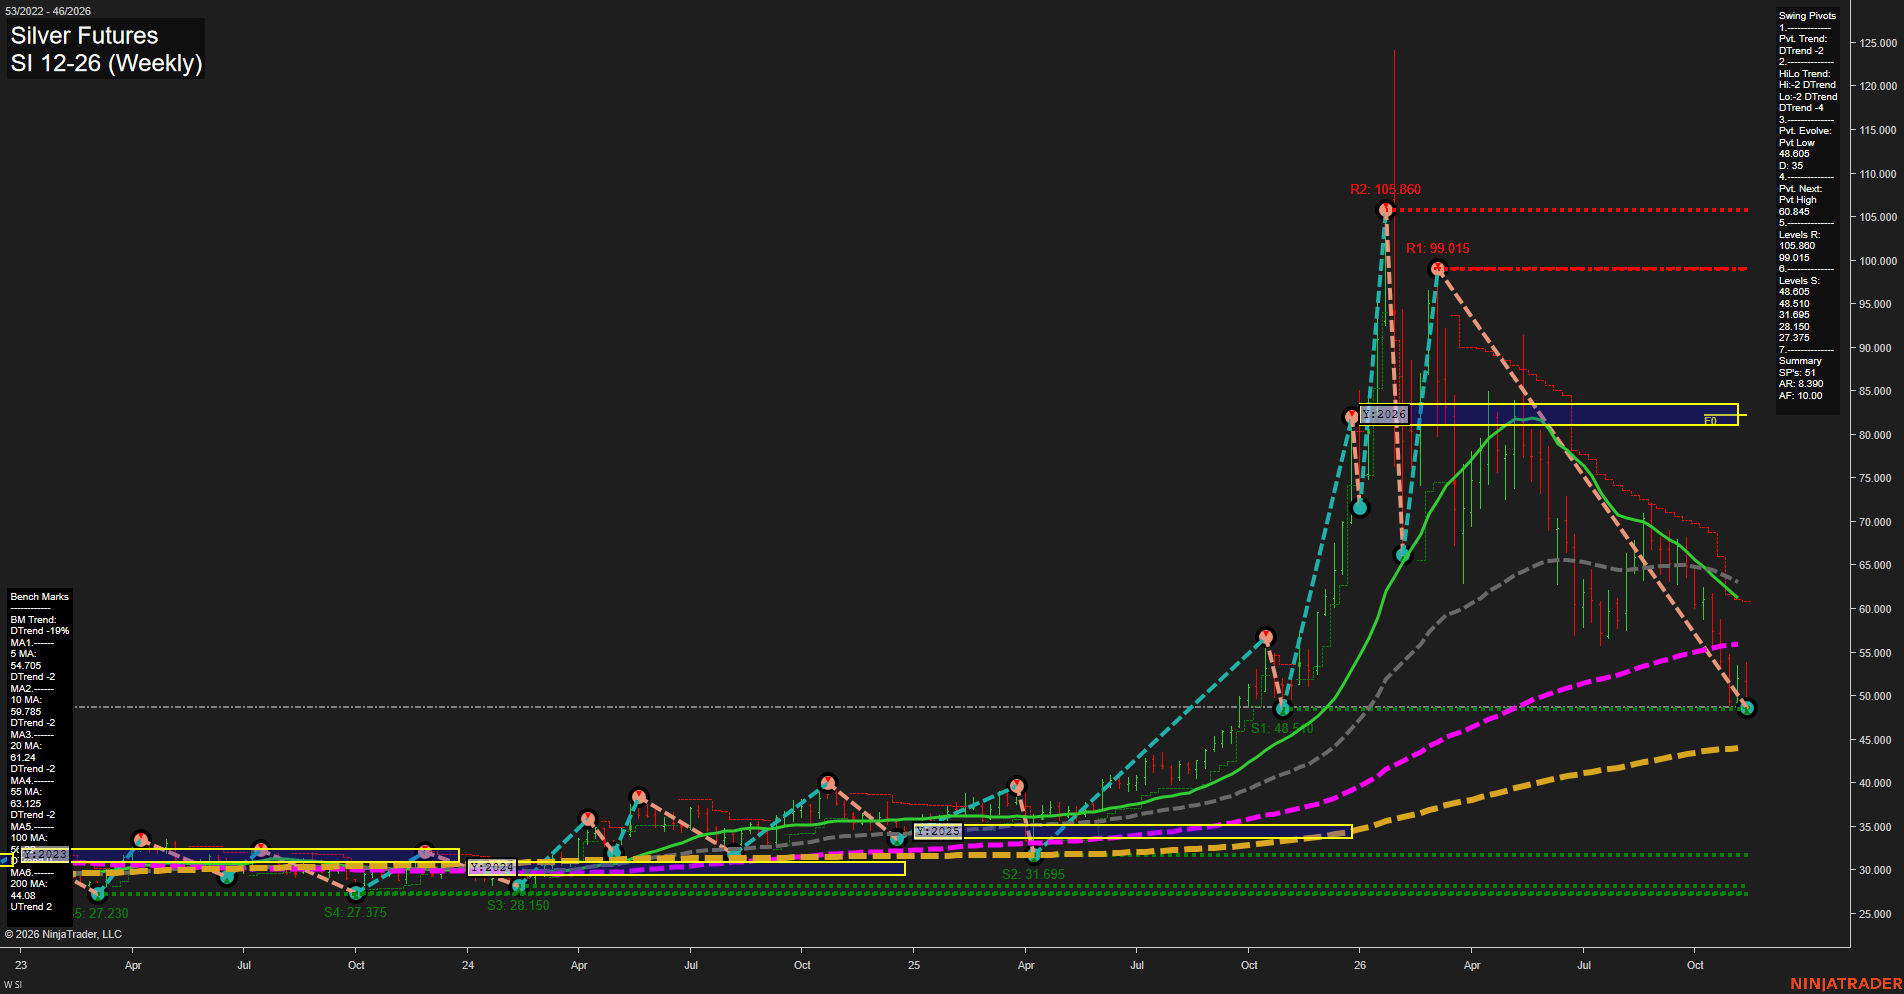
SI Silver Futures Weekly Chart Analysis — After Market Close: 2026-Nov-13 15:11 CT
Price Action
- Last: Approximately 49.0,
- Bars: Large,
- Mom: Momentum fast.
WSFG Weekly
- Near-Term
- WSFG Current: -52%
- F0%/NTZ' Bias: Price Below,
- WSFG Trend: Down.
MSFG Month Nov
- Medium-Term
- MSFG Current: -4%
- F0%/NTZ' Bias: Price Below,
- MSFG Trend: Down.
YSFG Year 2026
- Far-Term
- YSFG Current: -278%
- F0%/NTZ' Bias: Price Below,
- YSFG Trend: Down.
Swing Pivots
- (Near-Term) 1. Pvt. Trend: DTrend,
- (Medium-Term) 2. HiLo Trend: DTrend,
- 3. Pvt. Evolve: Pvt low 48.605,
- 4. Pvt. Next: Pvt high 60.845,
- 5. Levels R: 105.860, 99.015,
- 6. Levels S: 48.605, 48.510, 31.695, 28.150, 27.375.
Weekly Benchmarks
- (Near-Term) 5 Week: 54.705 Down Trend,
- (Near-Term) 10 Week: 59.785 Down Trend,
- (Medium-Term) 20 Week: 61.24 Down Trend,
- (Medium-Term) 55 Week: 63.125 Down Trend,
- (Far-Term) 100 Week: Approximately 56.0 Up Trend,
- (Far-Term) 200 Week: 44.08 Up Trend.
Recent Trade Signals
- 13 Nov 2026: Short SI 12-26 @ 50.46 Signals.USAR-WSFG
- 12 Nov 2026: Short SI 12-26 @ 51.36 Signals.USAR.TR120
Overall Rating
- Near-Term: Bearish,
- Medium-Term: Bearish,
- Far-Term: Neutral.
Key Insights Summary
Silver remains in a pronounced weekly downswing following the explosive rally and subsequent lower high at 99.015 beneath 105.860. Large weekly ranges and persistent lower highs and lows characterize a volatile trend reversal rather than an orderly pullback. Price is testing clustered pivot support at 48.605–48.510, with little separation between the latest evolving low and the earlier support. Both recent short signals reinforce the bearish near-term reading, while declining 5-, 10-, 20- and 55-week benchmarks confirm weakness through the medium term. The 60.845 opposite-pivot reversal threshold remains well above current price. Far-term evidence is mixed: the yearly grid is bearish and price is below the rising 100-week average, but remains above the rising 200-week average at 44.08. This describes a deep correction within a still-rising major benchmark structure. No news or seasonal catalyst can be established from the chart alone.
Chart Analysis ATS AI Generated: 2026-11-13 15:12 for Informational use only, not trading advice. Terms and Risk Disclosure Copyright © 2026. Algo Trading Systems LLC.