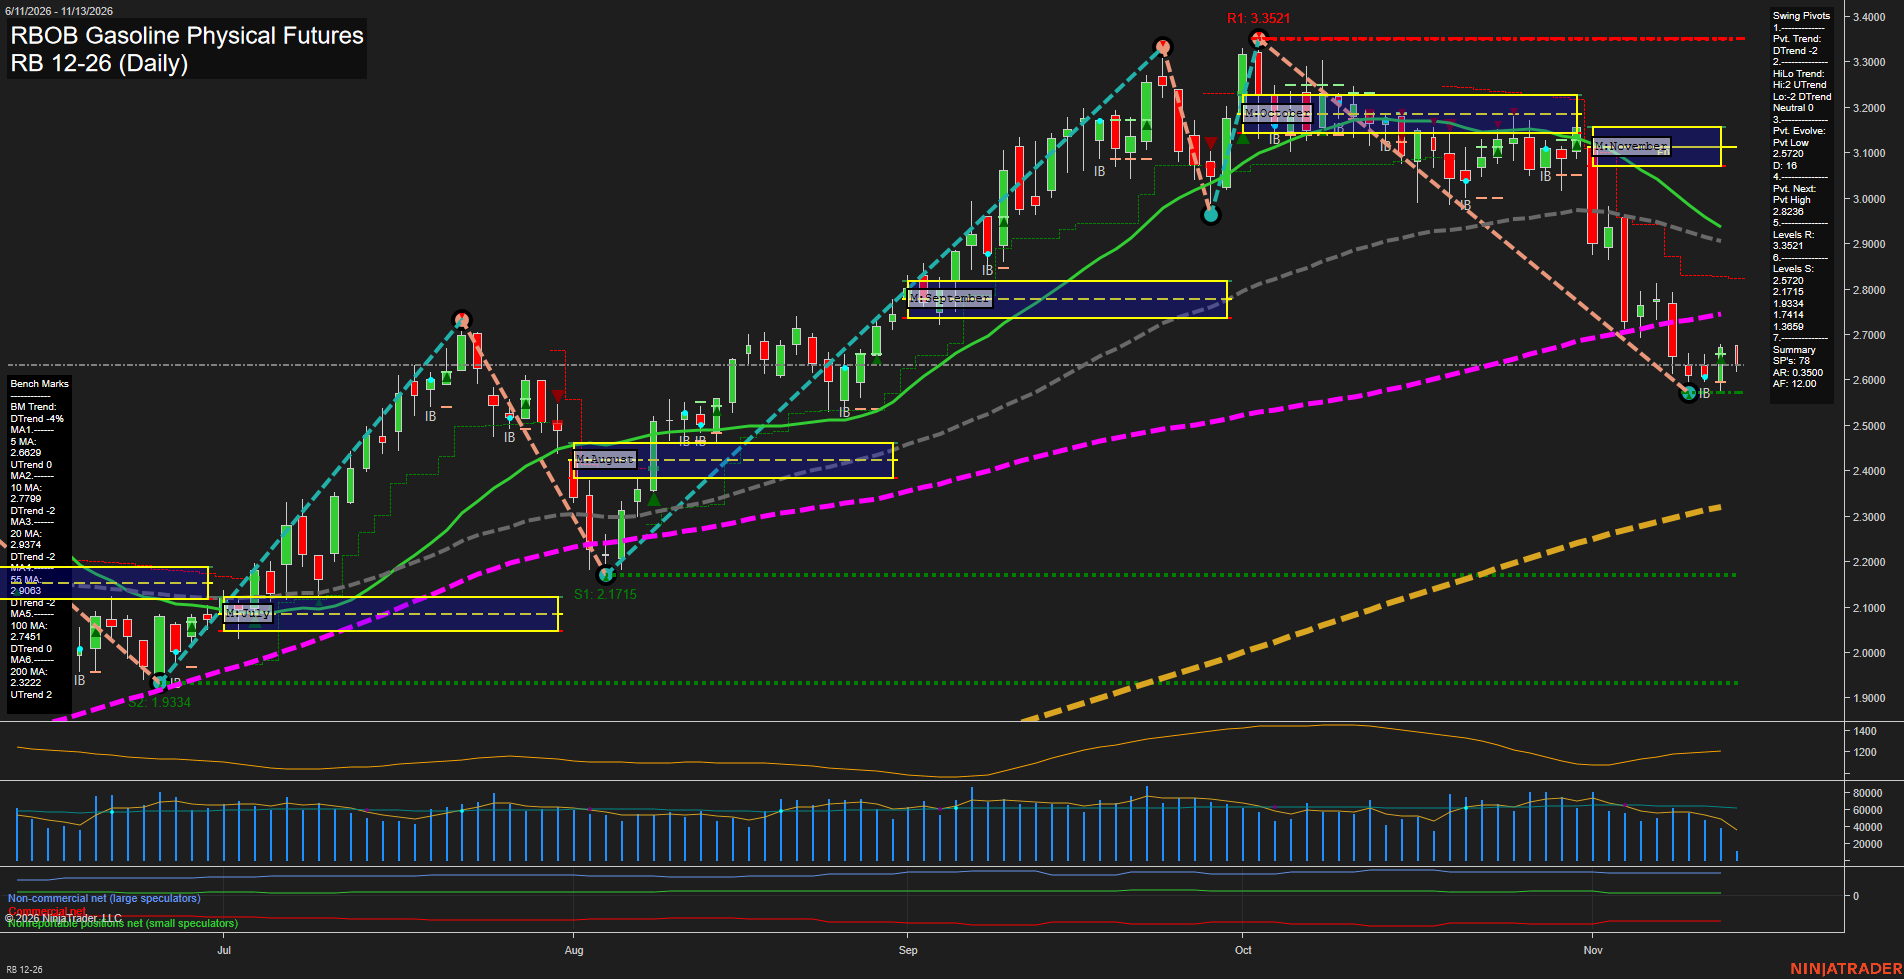
RB RBOB Gasoline Physical Futures Daily Chart Analysis — After Market Close: 2026-Nov-13 15:10 CT
Price Action
- Last: approximately 2.6300,
- Bars: Small,
- Mom: Momentum slow.
WSFG Weekly
- Near-Term
- WSFG Current: -55%
- F0%/NTZ' Bias: Price Below,
- WSFG Trend: Down.
MSFG Month Nov
- Medium-Term
- MSFG Current: -99%
- F0%/NTZ' Bias: Price Below,
- MSFG Trend: Down.
YSFG Year 2026
- Far-Term
- YSFG Current: 187%
- F0%/NTZ' Bias: Price Above,
- YSFG Trend: Up.
Swing Pivots
- (Near-Term) 1. Pvt. Trend: DTrend,
- (Medium-Term) 2. HiLo Trend: DTrend,
- 3. Pvt. Evolve: Pvt low 2.5720,
- 4. Pvt. Next: Pvt high 2.8236,
- 5. Levels R: 3.3521,
- 6. Levels S: 2.5720, 2.1715, 1.9334, 1.7414, 1.3659.
Daily Benchmarks
- (Near-Term) 5 Day: 2.6629 Up Trend,
- (Near-Term) 10 Day: 2.7799 Down Trend,
- (Medium-Term) 20 Day: 2.9374 Down Trend,
- (Medium-Term) 55 Day: 2.9063 Down Trend,
- (Far-Term) 100 Day: 2.7451 Down Trend,
- (Far-Term) 200 Day: 2.3222 Up Trend.
Additional Metrics
Recent Trade Signals
- 09 Nov 2026: Short RB 12-26 @ 2.7419 Signals.USAR-WSFG
Overall Rating
- Near-Term: Bearish,
- Medium-Term: Bearish,
- Far-Term: Bullish.
Key Insights Summary
The October peak at 3.3521 has given way to a sustained downswing, with November's sharp breakdown leaving price below the weekly and monthly neutral zones and every benchmark except the 200-day average. Recent small candles around 2.63 indicate slowing downside momentum and consolidation above the evolving 2.5720 pivot low, rather than a confirmed reversal. The rising five-day average is an early stabilization feature, but the declining ten-day average and bearish pivot trend retain the near-term downside bias. The pivot summary identifies mixed medium-term structure, with rising highs but declining lows; its net directional reading remains bearish. The 2.8236 next-pivot threshold sits above the current consolidation, while 3.3521 remains the listed swing resistance. Far-term conditions remain bullish by majority, supported by the rising 200-day average and positive yearly grid, although price below the declining 100-day benchmark shows substantial corrective damage. The supplied weekly short signal aligns with the prevailing downswing. Seasonal demand softness can provide context for gasoline weakness, but this chart alone does not establish a news-driven catalyst.
Chart Analysis ATS AI Generated: 2026-11-13 15:11 for Informational use only, not trading advice. Terms and Risk Disclosure Copyright © 2026. Algo Trading Systems LLC.