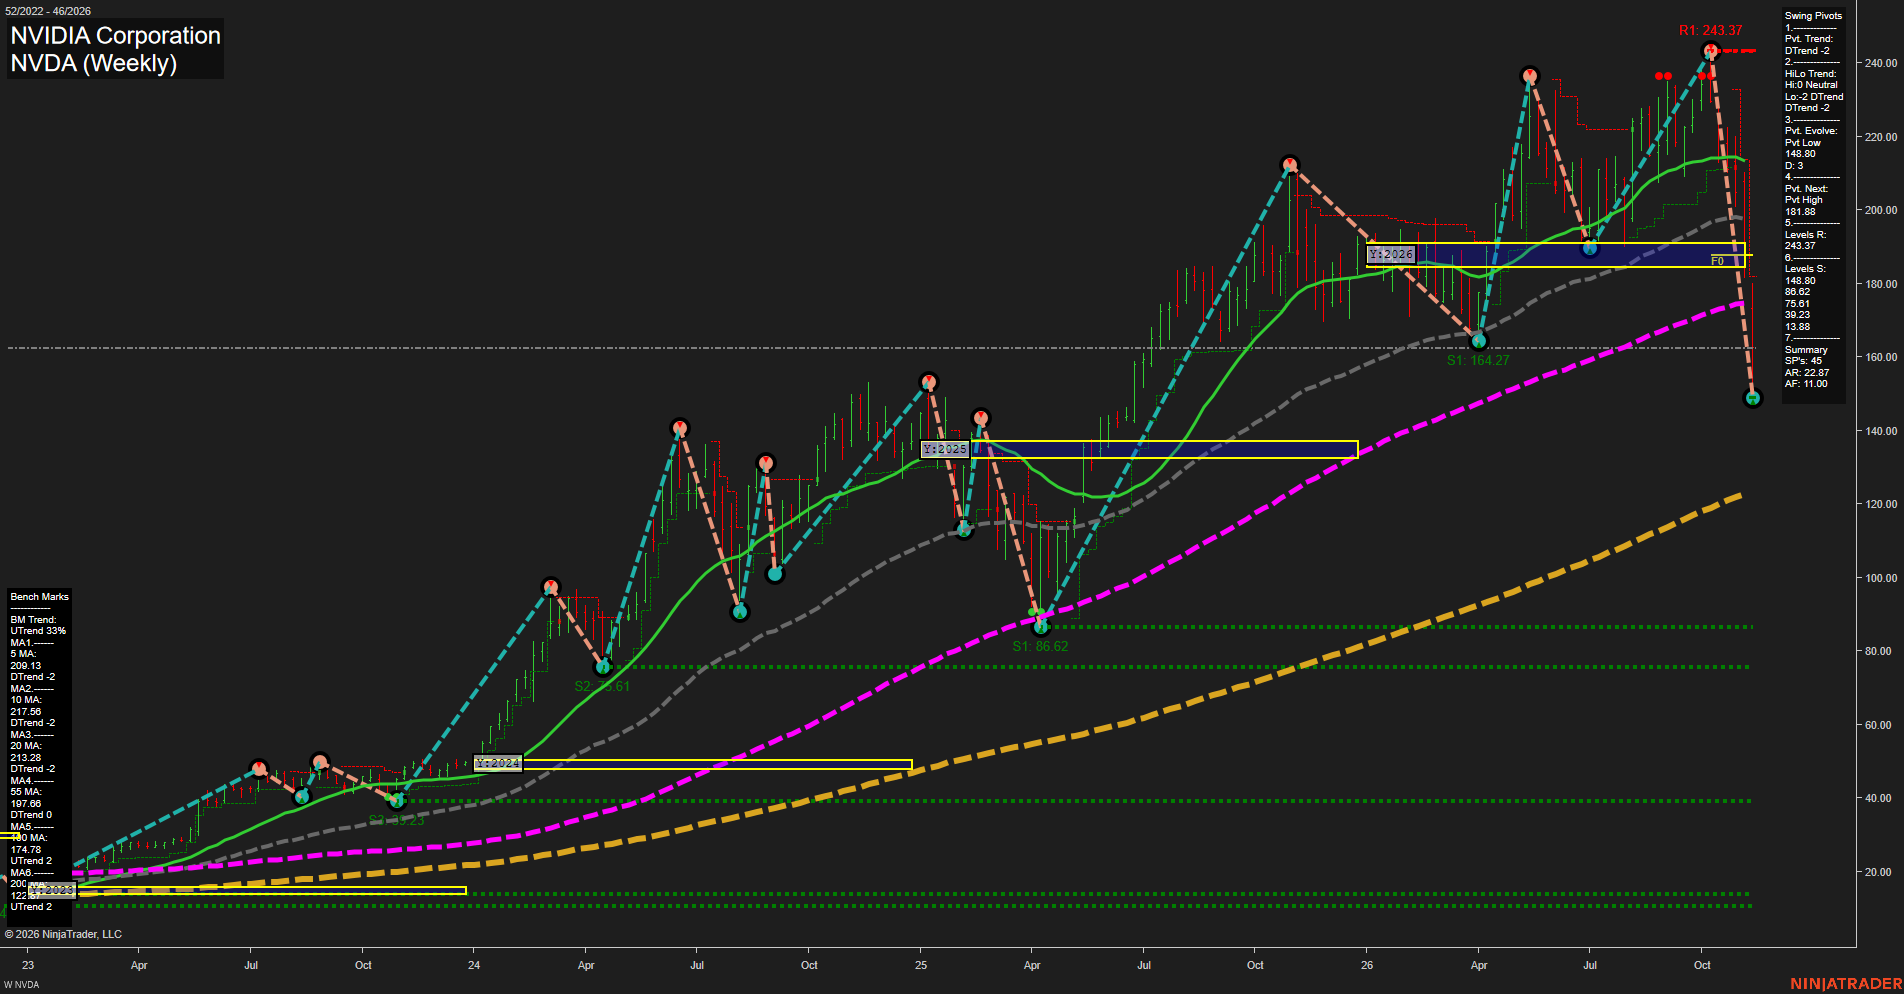
NVDA NVIDIA Corporation Weekly Chart Analysis — After Market Close: 2026-Nov-13 15:10 CT
Price Action
- Last: Not legible; evolving pivot low is 148.80,
- Bars: Large,
- Mom: Momentum fast to the downside.
WSFG Weekly
- Near-Term
- WSFG Current: NA%
- F0%/NTZ' Bias: Price Neutral,
- WSFG Trend: Neutral.
MSFG Month Nov
- Medium-Term
- MSFG Current: NA%
- F0%/NTZ' Bias: Price Neutral,
- MSFG Trend: Neutral.
YSFG Year 2026
- Far-Term
- YSFG Current: NA%
- F0%/NTZ' Bias: Price Neutral,
- YSFG Trend: Neutral.
Swing Pivots
- (Near-Term) 1. Pvt. Trend: DTrend,
- (Medium-Term) 2. HiLo Trend: DTrend,
- 3. Pvt. Evolve: Pvt low 148.80,
- 4. Pvt. Next: Pvt high 181.88,
- 5. Levels R: 243.37,
- 6. Levels S: 148.80, 86.62, 75.61, 39.23, 13.88.
Weekly Benchmarks
- (Near-Term) 5 Week: 209.13 Down Trend,
- (Near-Term) 10 Week: 217.56 Down Trend,
- (Medium-Term) 20 Week: 213.28 Down Trend,
- (Medium-Term) 55 Week: 197.66 Down Trend,
- (Far-Term) 100 Week: 174.78 Up Trend,
- (Far-Term) 200 Week: Approximately 122.67 Up Trend.
Overall Rating
- Near-Term: Bearish,
- Medium-Term: Bearish,
- Far-Term: Neutral.
Key Insights Summary
From a futures swing trader’s perspective, the dominant feature is rapid downside range expansion following the 243.37 swing high. The evolving 148.80 low undercuts the prior 164.27 swing low, while declining 5-, 10-, 20- and 55-week benchmarks reinforce bearish near- and medium-term structure. The 181.88 next-pivot threshold marks the chart’s potential swing reversal reference, not a confirmed reversal. Rising 100- and 200-week benchmarks preserve a longer-term bullish backdrop, but the deep retracement leaves the far-term picture mixed. The displayed yearly neutral zone is approximately 185–191, above the evolving low; its neutral template classification does not independently confirm price acceptance within that zone. Weekly and monthly grids and the specified recent trade signals are not displayed, so their direction cannot be verified. This is an NVDA equity chart rather than a futures contract chart; contract basis, leverage and overnight futures behavior are not represented. No news or seasonal catalyst can be established from the image.
Chart Analysis ATS AI Generated: 2026-11-13 15:10 for Informational use only, not trading advice. Terms and Risk Disclosure Copyright © 2026. Algo Trading Systems LLC.