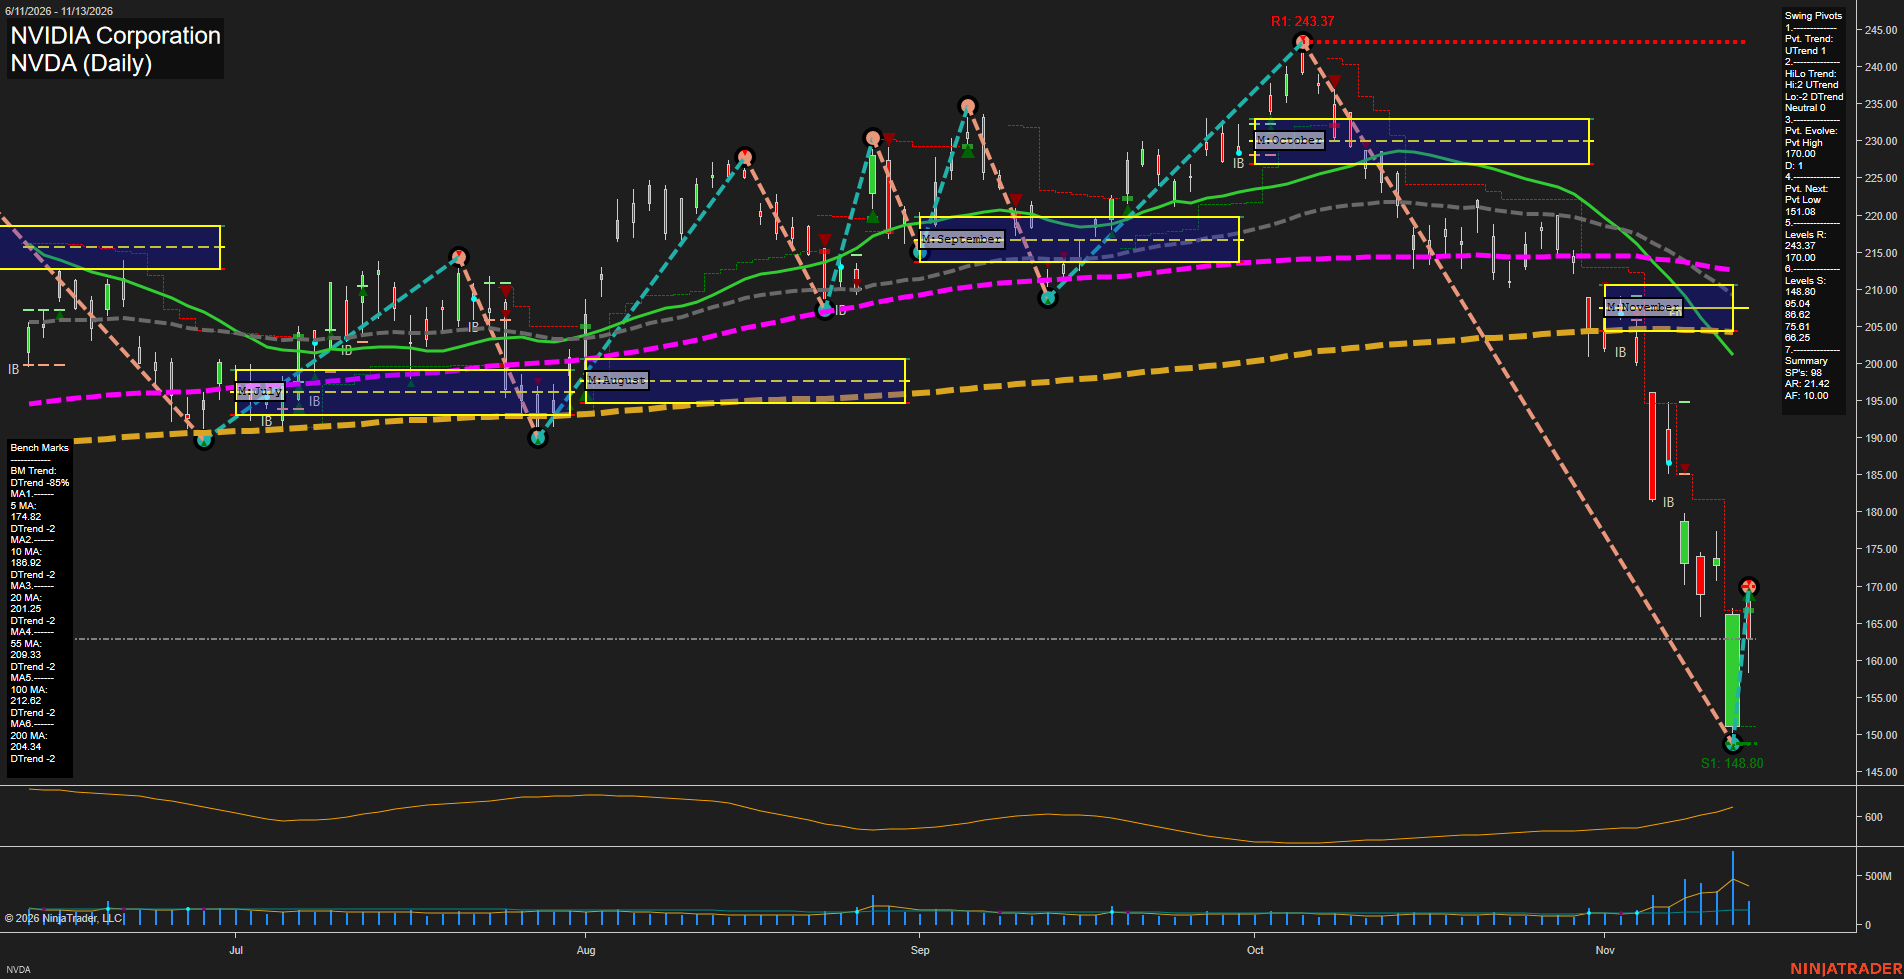
NVDA NVIDIA Corporation Daily Chart Analysis — After Market Close: 2026-Nov-13 15:09 CT
Price Action
- Last: Approximately 163.00,
- Bars: Large,
- Mom: Fast.
WSFG Weekly
- Near-Term
- WSFG Current: NA%
- F0%/NTZ' Bias: Price Neutral,
- WSFG Trend: Neutral.
MSFG Month Nov
- Medium-Term
- MSFG Current: NA%
- F0%/NTZ' Bias: Price Neutral,
- MSFG Trend: Neutral.
YSFG Year 2026
- Far-Term
- YSFG Current: NA%
- F0%/NTZ' Bias: Price Neutral,
- YSFG Trend: Neutral.
Swing Pivots
- (Near-Term) 1. Pvt. Trend: UTrend,
- (Medium-Term) 2. HiLo Trend: Neutral,
- 3. Pvt. Evolve: Pvt high 170.00,
- 4. Pvt. Next: Pvt low 151.08,
- 5. Levels R: 243.37, 170.00,
- 6. Levels S: 148.80, 95.04, 86.62, 75.61, 66.25.
Daily Benchmarks
- (Near-Term) 5 Day: 174.82 Down Trend,
- (Near-Term) 10 Day: 186.92 Down Trend,
- (Medium-Term) 20 Day: 201.25 Down Trend,
- (Medium-Term) 55 Day: 209.33 Down Trend,
- (Far-Term) 100 Day: 212.62 Down Trend,
- (Far-Term) 200 Day: 204.34 Down Trend.
Additional Metrics
- ATR: 599,
- VOLMA: 346637249.
Overall Rating
- Near-Term: Bearish,
- Medium-Term: Bearish,
- Far-Term: Bearish.
Key Insights Summary
From a futures swing trader’s perspective, the dominant feature is a rapid downside expansion from 243.37 to 148.80, followed by a sharp countertrend rebound toward 170.00. The near-term pivot has turned upward, but price remains below all six declining benchmarks, leaving the broader bearish structure intact. The pivot summary explicitly reports a neutral medium-term HiLo trend, reflecting mixed high and low sequences rather than an established recovery. Large daily ranges, rising ATR, and heavier recent volume characterize a volatile liquidation-and-rebound phase; the rebound alone does not establish a durable reversal. November price is below its monthly NTZ near 204–211, a bearish location despite the neutral grid placeholders above. Weekly and yearly grids and the named trade-signal readings are not visible; news and seasonal explanations cannot be established from this chart. NVDA is an equity chart, so these observations describe its underlying price structure rather than futures-specific basis, leverage, or contract behavior.
Chart Analysis ATS AI Generated: 2026-11-13 15:10 for Informational use only, not trading advice. Terms and Risk Disclosure Copyright © 2026. Algo Trading Systems LLC.