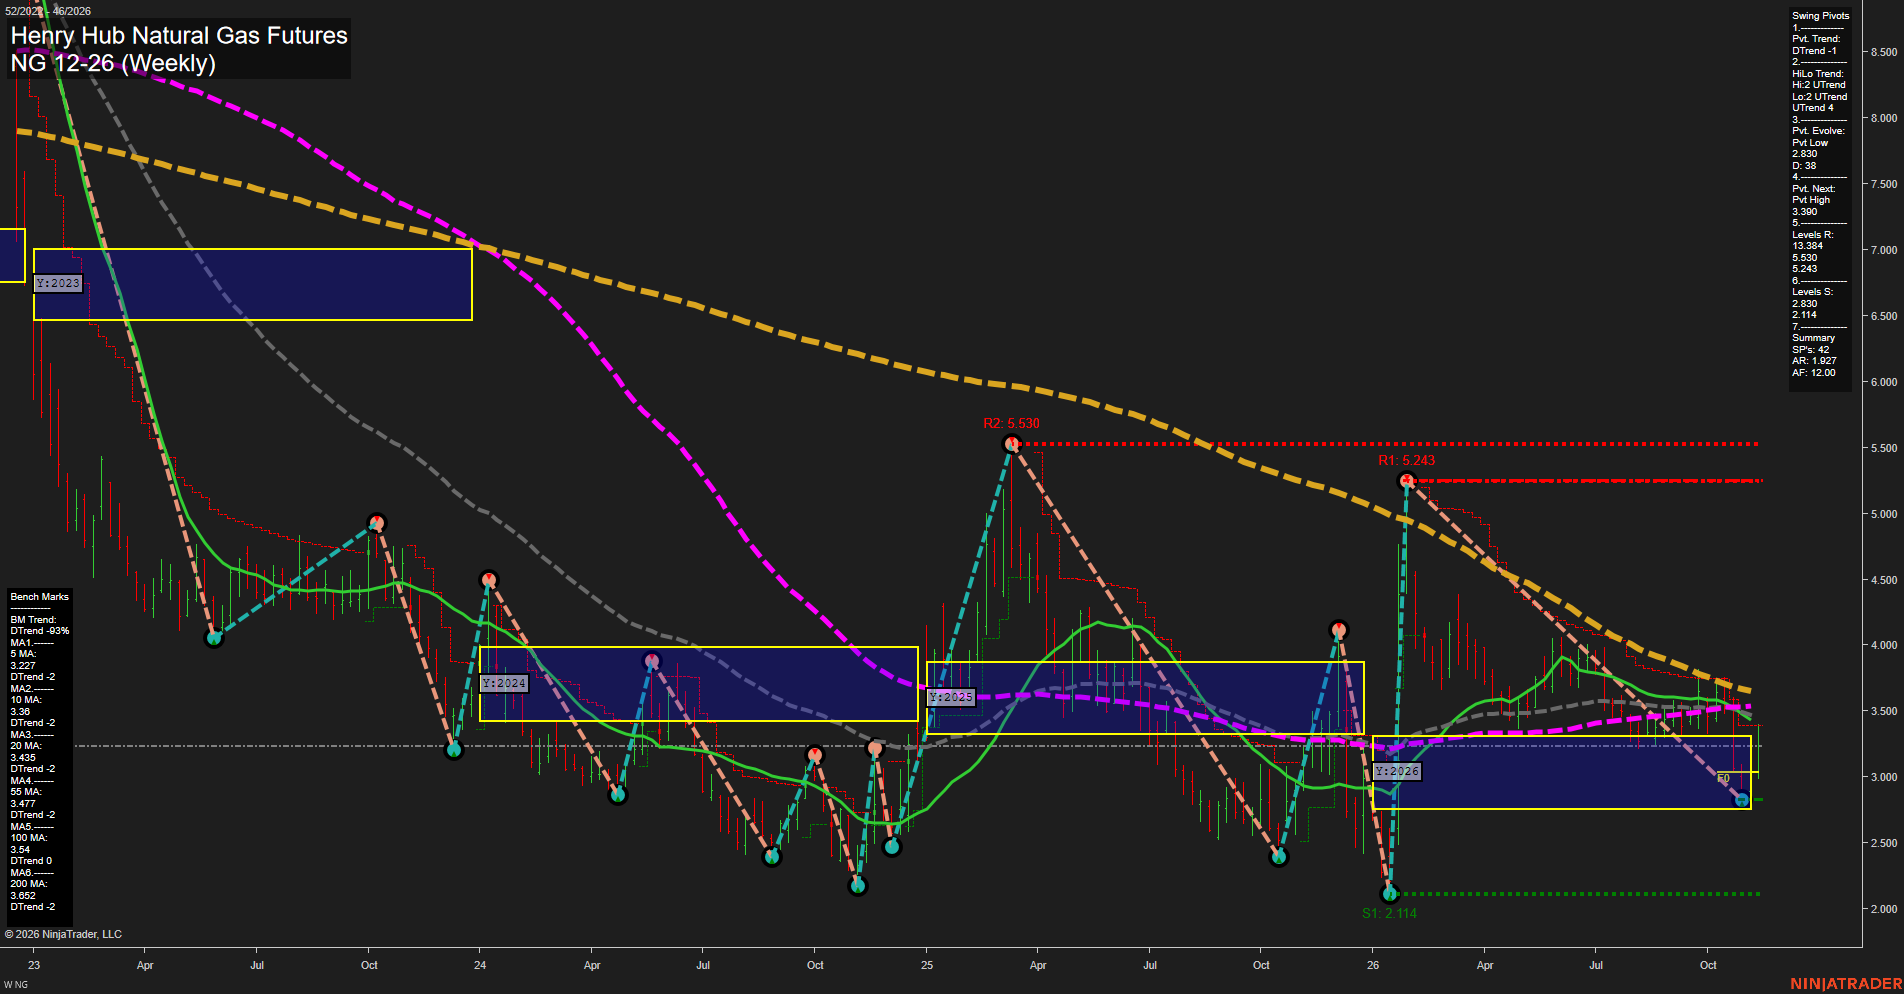
NG Henry Hub Natural Gas Futures Weekly Chart Analysis — After Market Close: 2026-Nov-13 15:08 CT
Price Action
- Last: Approximately 3.23,
- Bars: Medium,
- Mom: Momentum average.
WSFG Weekly
- Near-Term
- WSFG Current: 63%
- F0%/NTZ' Bias: Price Above,
- WSFG Trend: Up.
MSFG Month Nov
- Medium-Term
- MSFG Current: 66%
- F0%/NTZ' Bias: Price Above,
- MSFG Trend: Up.
YSFG Year 2026
- Far-Term
- YSFG Current: 7%
- F0%/NTZ' Bias: Price Above,
- YSFG Trend: Up.
Swing Pivots
- (Near-Term) 1. Pvt. Trend: DTrend,
- (Medium-Term) 2. HiLo Trend: UTrend,
- 3. Pvt. Evolve: Pvt low 2.830,
- 4. Pvt. Next: Pvt high 3.390,
- 5. Levels R: 13.384, 5.530, 5.243,
- 6. Levels S: 2.830, 2.114.
Weekly Benchmarks
- (Near-Term) 5 Week: 3.227 Down Trend,
- (Near-Term) 10 Week: 3.360 Down Trend,
- (Medium-Term) 20 Week: 3.435 Down Trend,
- (Medium-Term) 55 Week: 3.477 Down Trend,
- (Far-Term) 100 Week: 3.540 Flat Trend,
- (Far-Term) 200 Week: 3.652 Down Trend.
Recent Trade Signals
- 10 Nov 2026: Long NG 12-26 @ 3.214 Signals.USAR.TR720
- 06 Nov 2026: Long NG 12-26 @ 2.997 Signals.USAR-MSFG
- 05 Nov 2026: Long NG 12-26 @ 2.95 Signals.USAR-WSFG
Overall Rating
- Near-Term: Bullish,
- Medium-Term: Bullish,
- Far-Term: Bullish.
Key Insights Summary
The swing-trading picture is a developing bullish recovery within a broader declining benchmark structure, rather than a confirmed broad-based uptrend. Price has rebounded from the evolving 2.830 pivot low, with weekly and monthly grid strength and successive long signals supporting improving momentum. However, the near-term pivot remains DTrend; 3.390 is the stated reversal threshold. The medium-term HiLo UTrend reflects higher major swing highs and lows, despite the recent downswing. Overhead benchmarks cluster from 3.360 to 3.652, defining substantial technical resistance to the recovery, while pivot supports remain 2.830 and 2.114. Bullish overall ratings reflect the balance of grid trends, pivot structure and supplied signals, but falling benchmarks show incomplete trend confirmation. November's transition toward winter heating demand provides seasonal context; this chart alone does not establish a weather, storage or news catalyst.
Chart Analysis ATS AI Generated: 2026-11-13 15:09 for Informational use only, not trading advice. Terms and Risk Disclosure Copyright © 2026. Algo Trading Systems LLC.