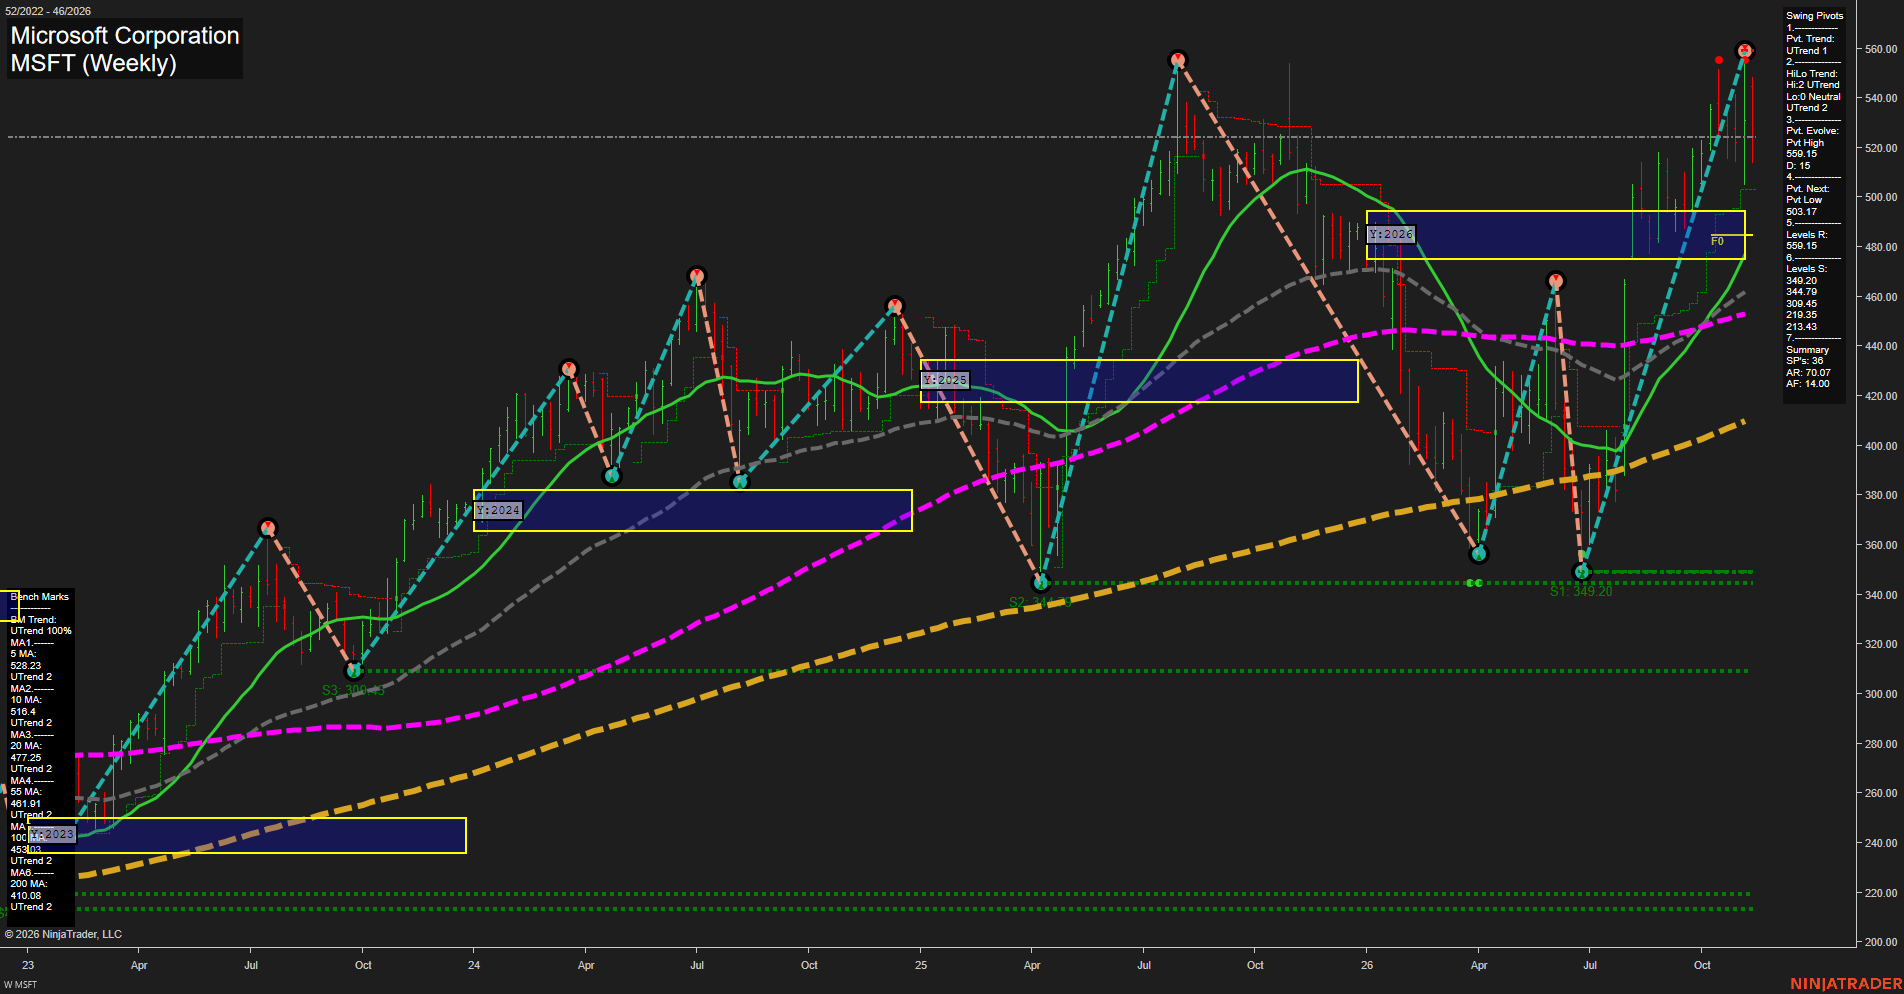
MSFT Microsoft Corporation Weekly Chart Analysis — After Market Close: 2026-Nov-13 15:08 CT
Price Action
- Last: Approximately 524,
- Bars: Large,
- Mom: Fast advance followed by slowing upside momentum.
WSFG Weekly
- Near-Term
- WSFG Current: NA%
- F0%/NTZ' Bias: Price Neutral,
- WSFG Trend: Neutral.
MSFG Month Nov
- Medium-Term
- MSFG Current: NA%
- F0%/NTZ' Bias: Price Neutral,
- MSFG Trend: Neutral.
YSFG Year 2026
- Far-Term
- YSFG Current: NA%
- F0%/NTZ' Bias: Price Above NTZ,
- YSFG Trend: Bullish.
Swing Pivots
- (Near-Term) 1. Pvt. Trend: UTrend,
- (Medium-Term) 2. HiLo Trend: UTrend,
- 3. Pvt. Evolve: Pvt high 559.15,
- 4. Pvt. Next: Pvt low 503.17,
- 5. Levels R: 559.15,
- 6. Levels S: 349.20, 344.79, 309.45, 219.35, 213.43.
Weekly Benchmarks
- (Near-Term) 5 Week: 528.23 Up Trend,
- (Near-Term) 10 Week: 516.4 Up Trend,
- (Medium-Term) 20 Week: 477.25 Up Trend,
- (Medium-Term) 55 Week: 461.91 Up Trend,
- (Far-Term) 100 Week: 453.03 Up Trend,
- (Far-Term) 200 Week: 410.08 Up Trend.
Overall Rating
- Near-Term: Bullish,
- Medium-Term: Bullish,
- Far-Term: Bullish.
Key Insights Summary
From a futures swing trader’s perspective, the dominant structure is a strong upward impulse followed by a volatile retracement beneath 559.15 resistance. The approximate last-price reference sits below the rising five-week benchmark but above the ten-week benchmark, indicating cooling near-term momentum within an established uptrend. The pivot summary identifies 503.17 as the reversal threshold for a new pivot low; it is distinct from the confirmed support levels listed above. Medium-term strength is supported by rising benchmarks and a higher-high pivot structure, although the summary labels the low-pivot component neutral. Price remains above the yearly neutral zone, approximately 475–495, while the rising 100- and 200-week benchmarks reinforce the bullish far-term backdrop. Large weekly ranges indicate substantial two-way volatility rather than a smooth trend. Weekly and monthly fib grids and the specified recent trade-signal readings are not visible; their neutral entries represent unavailable confirmation, not demonstrated sideways conditions. The chart alone does not establish news or seasonal drivers, and it depicts MSFT shares rather than a futures contract.
Chart Analysis ATS AI Generated: 2026-11-13 15:08 for Informational use only, not trading advice. Terms and Risk Disclosure Copyright © 2026. Algo Trading Systems LLC.