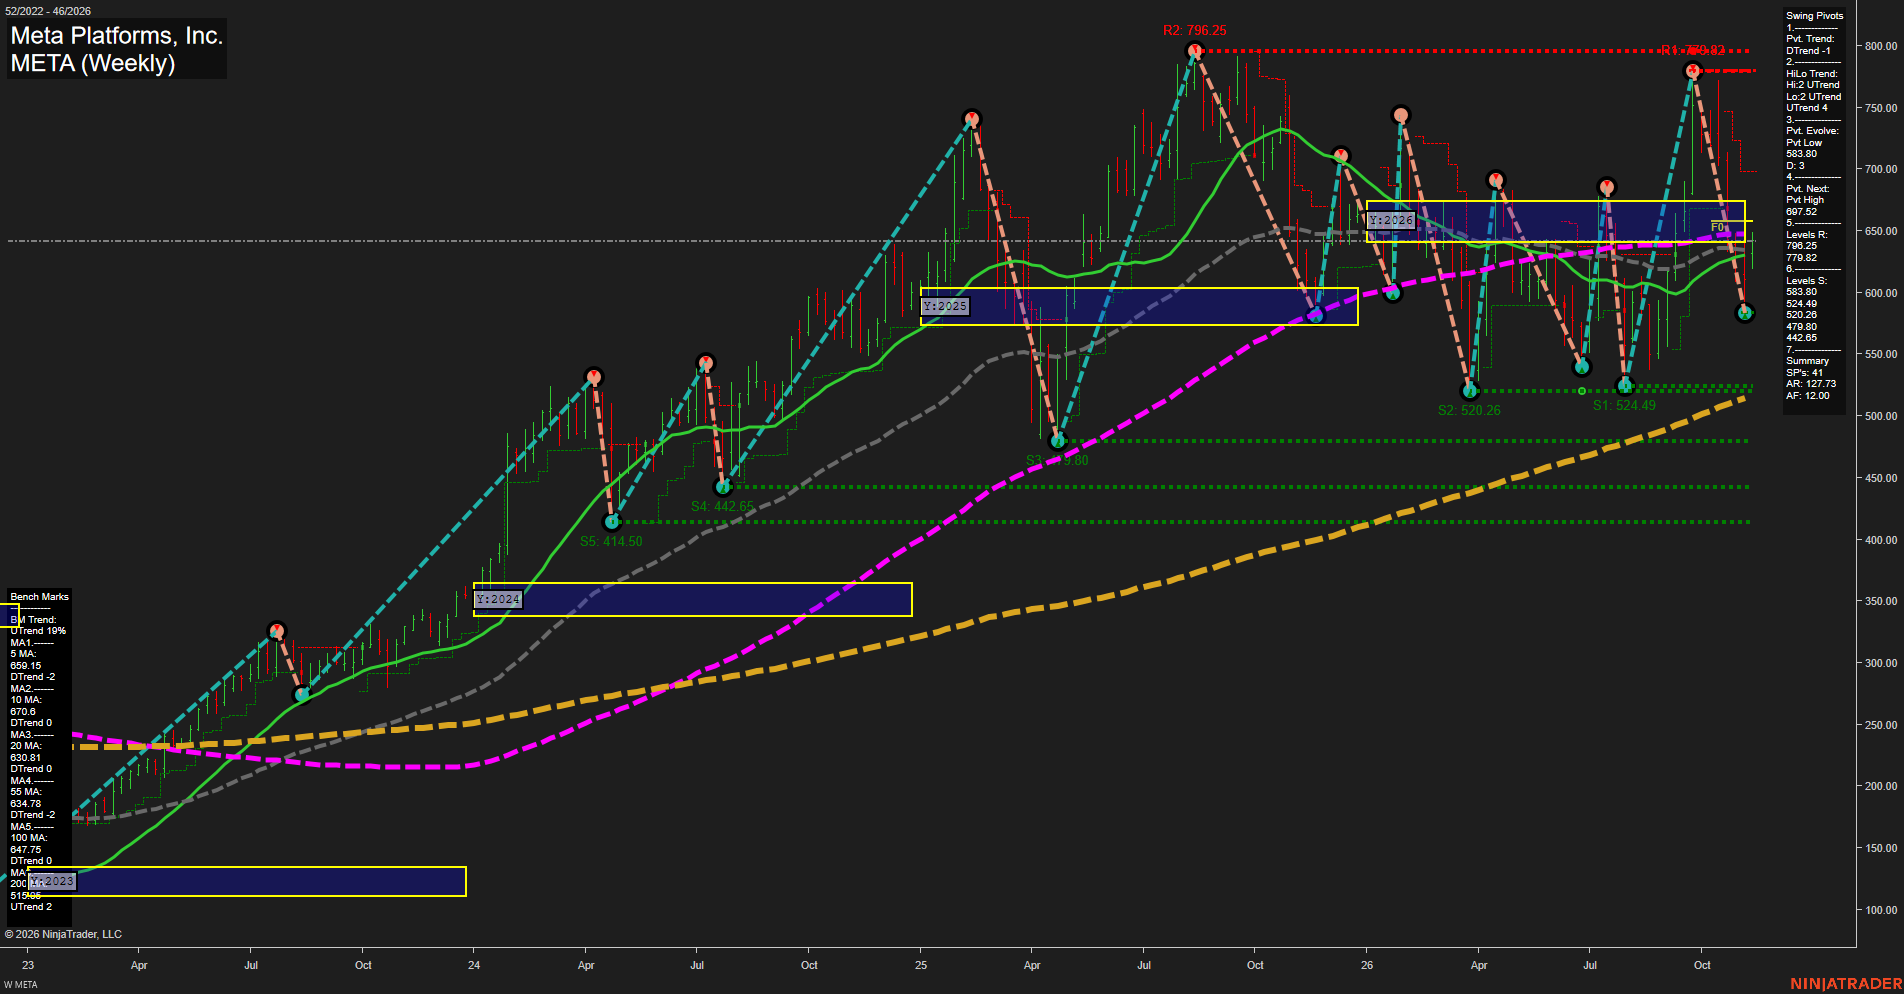
META Meta Platforms; Inc. Weekly Chart Analysis — After Market Close: 2026-Nov-13 15:07 CT
Price Action
- Last: Approximately 642,
- Bars: Large,
- Mom: Momentum fast on the downswing, with a developing rebound.
WSFG Weekly
- Near-Term
- WSFG Current: NA%
- F0%/NTZ' Bias: Price Neutral,
- WSFG Trend: Neutral.
MSFG Month Nov
- Medium-Term
- MSFG Current: NA%
- F0%/NTZ' Bias: Price Neutral,
- MSFG Trend: Neutral.
YSFG Year 2026
- Far-Term
- YSFG Current: NA%
- F0%/NTZ' Bias: Price Neutral,
- YSFG Trend: Neutral.
Swing Pivots
- (Near-Term) 1. Pvt. Trend: DTrend,
- (Medium-Term) 2. HiLo Trend: UTrend,
- 3. Pvt. Evolve: Pvt low 583.80,
- 4. Pvt. Next: Pvt high 697.52,
- 5. Levels R: 796.25, 779.82,
- 6. Levels S: 583.80, 524.49, 520.26, 479.80, 442.65.
Weekly Benchmarks
- (Near-Term) 5 Week: 659.15 Down Trend,
- (Near-Term) 10 Week: 670.60 Down Trend,
- (Medium-Term) 20 Week: 630.81 Down Trend,
- (Medium-Term) 55 Week: 634.78 Down Trend,
- (Far-Term) 100 Week: 647.75 Down Trend,
- (Far-Term) 200 Week: Approximately 515 Up Trend.
Overall Rating
- Near-Term: Bearish,
- Medium-Term: Neutral,
- Far-Term: Neutral.
Key Insights Summary
From a futures swing trader’s perspective, this is a volatile corrective downswing within a broader rising structure, rather than a confirmed upside continuation. The decline from 779.82 to the evolving 583.80 low has produced substantial range expansion, followed by a rebound toward the tightly clustered 20-, 55-, and 100-week benchmarks around 631–648. Price remains below the declining 5- and 10-week benchmarks, keeping near-term momentum bearish despite the bounce. The medium-term higher-high/higher-low pivot classification contrasts with declining medium-term averages, producing a mixed assessment. The 2026 yearly neutral zone contains the current price area near its lower boundary. Longer-term structure remains supported by the rising 200-week average, while the declining 100-week benchmark limits trend alignment. The chart identifies 697.52 as the next opposite-pivot reversal threshold; 583.80 remains the immediate evolving support reference. Recent named trade signals, weekly and monthly grids, and news catalysts are not displayed, so they cannot independently confirm the assessment.
Chart Analysis ATS AI Generated: 2026-11-13 15:08 for Informational use only, not trading advice. Terms and Risk Disclosure Copyright © 2026. Algo Trading Systems LLC.