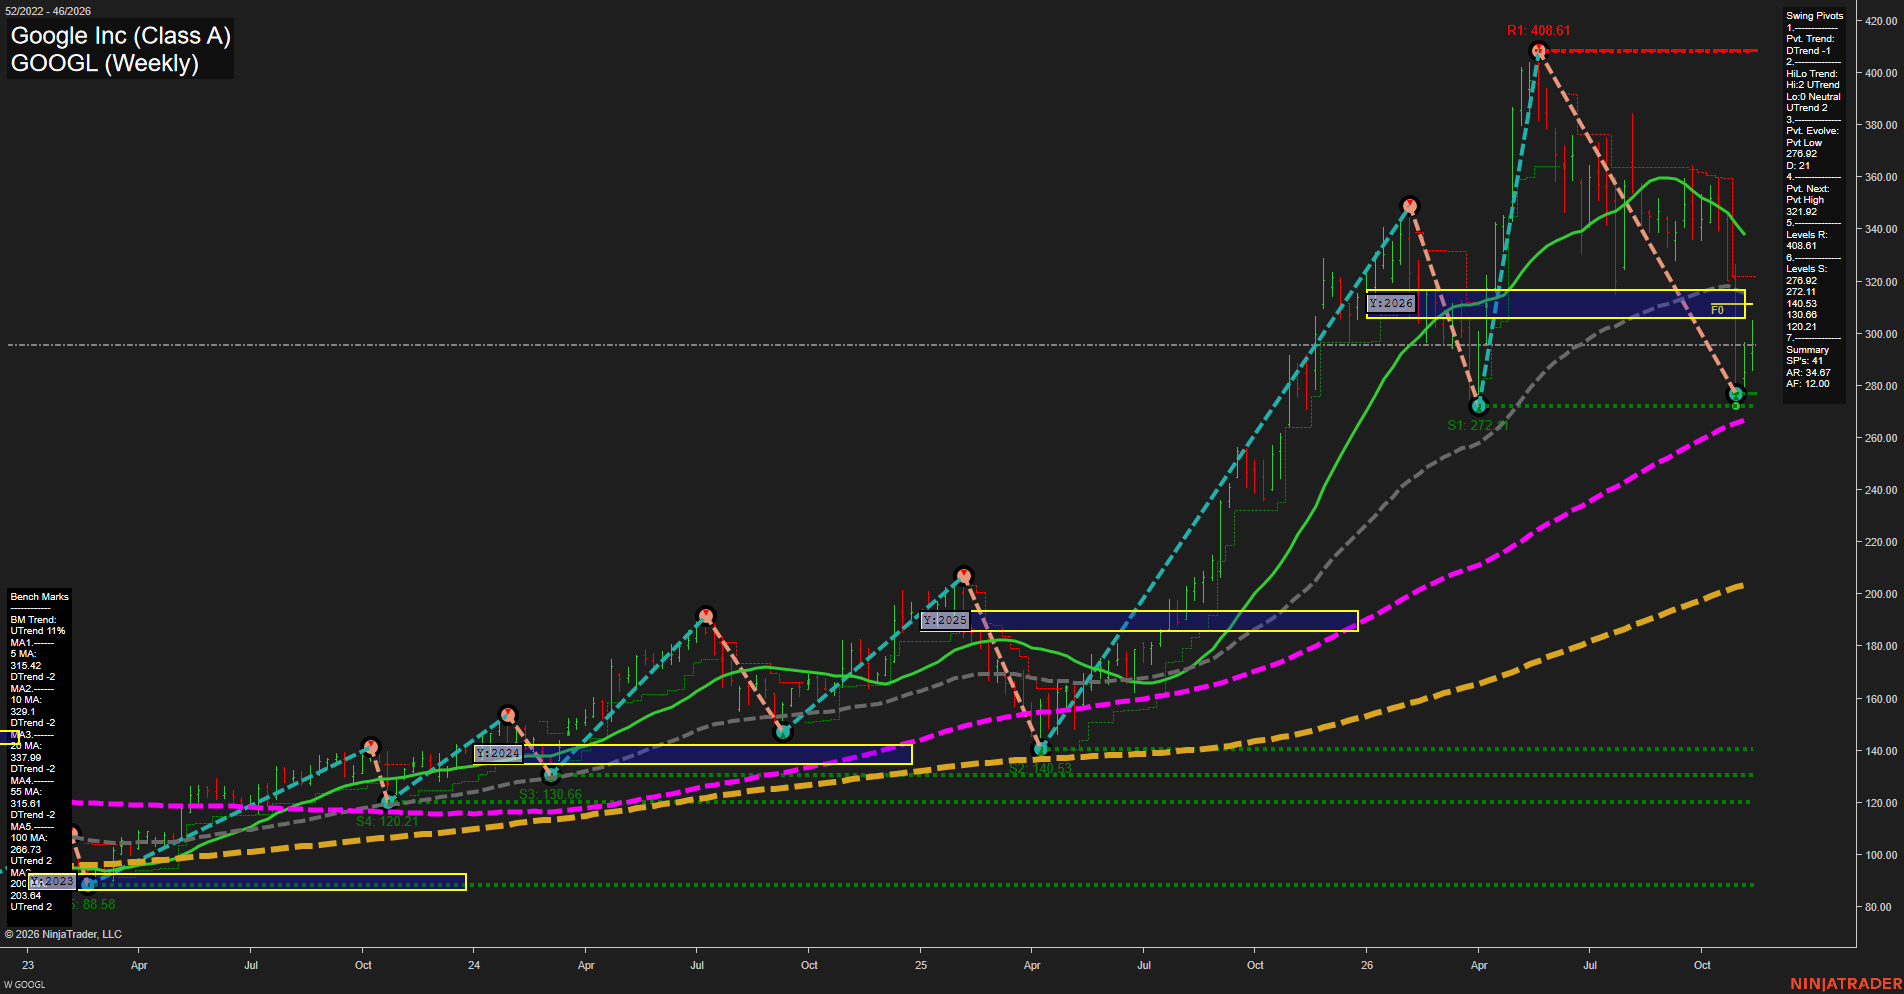
From a futures swing trader’s perspective, the dominant feature is a fast corrective downswing within a still-rising long-term structure. The decline from 408.61 to the evolving 276.92 low represents approximately 32% peak-to-trough compression. Price has rebounded toward 296 but remains below all four shorter benchmarks and the annual NTZ around 306–317, leaving the rebound countertrend on the near-term chart. The 315–322 area concentrates the 5-week and 55-week averages, annual NTZ, and next-pivot reversal threshold. Support is clustered at 276.92–272.11, above the rising 100-week average at 266.73. The medium-term HiLo uptrend contrasts with falling 20-week and 55-week benchmarks, indicating structural deterioration without a confirmed reversal of the broader pivot hierarchy. Far-term bullishness rests on price remaining above rising 100-week and 200-week averages, despite the bearish annual-grid position. Weekly and monthly grids and the specified recent trade-signal summaries are not visible; their neutral entries indicate unavailable confirmation rather than observed neutrality. This is a weekly equity chart, not a futures contract chart; contract-specific volume, positioning, and roll effects cannot be assessed.