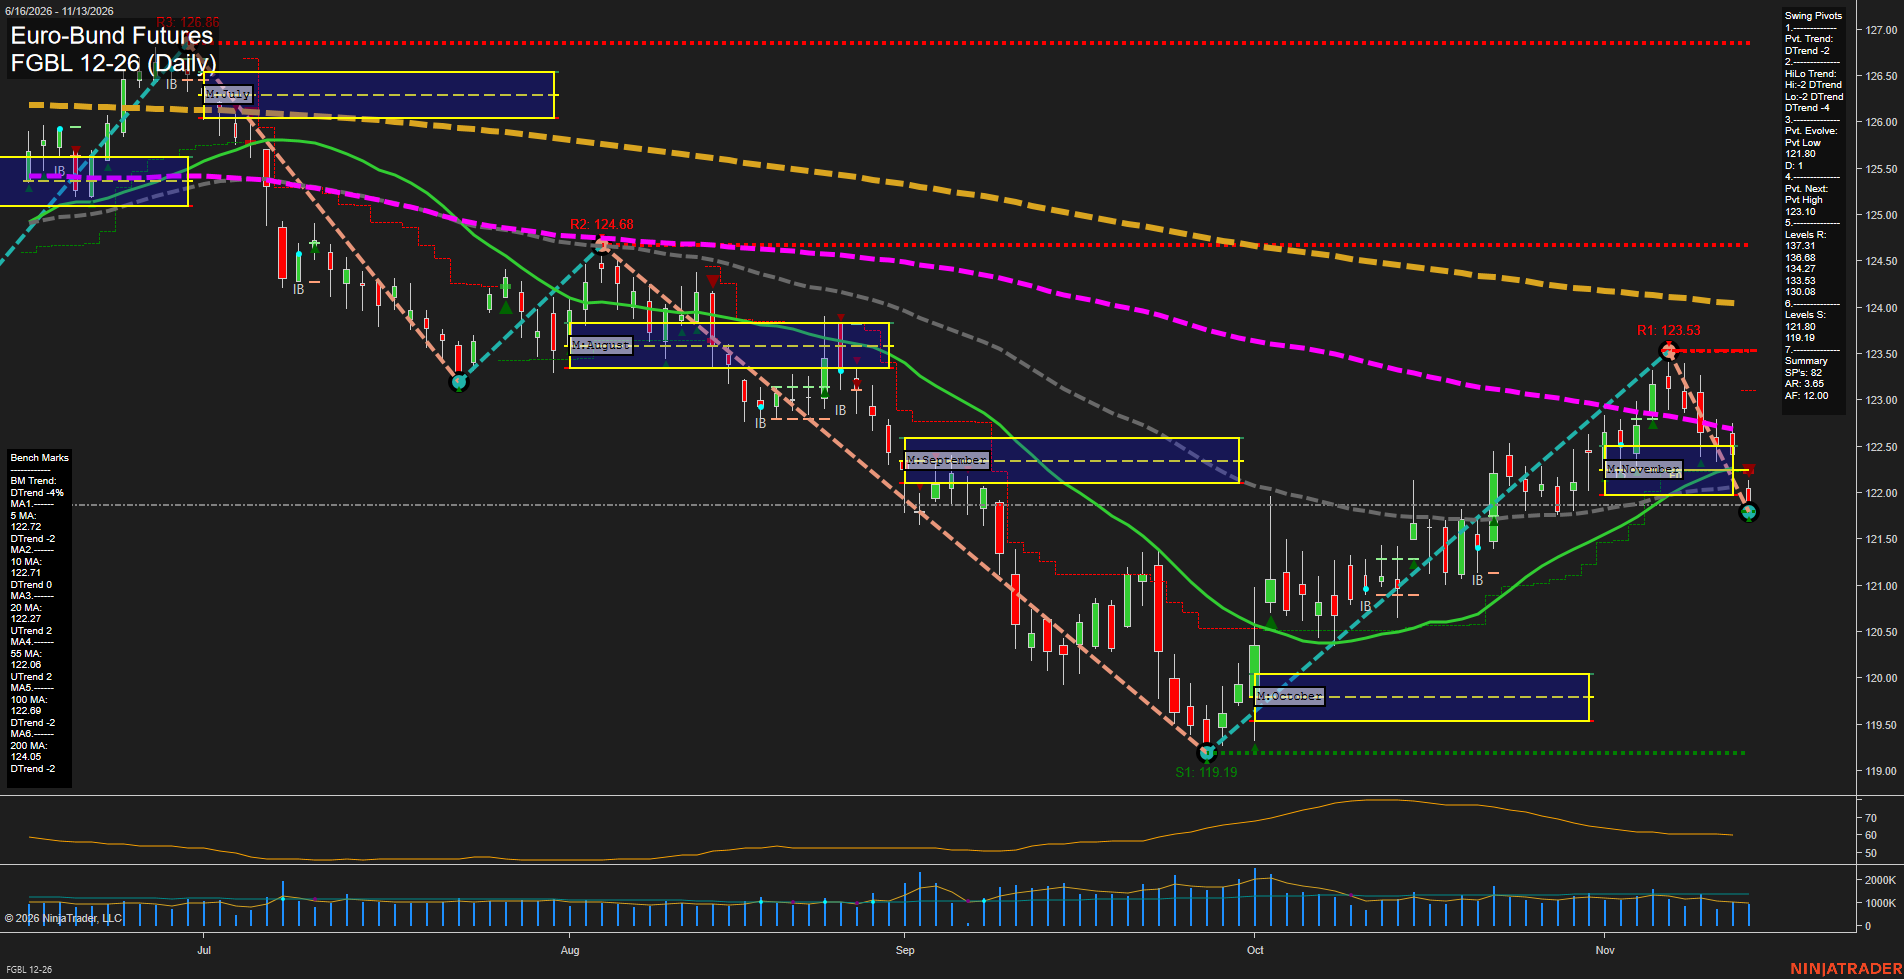
FGBL Euro-Bund Futures Daily Chart Analysis — After Market Close: 2026-Nov-13 15:05 CT
Price Action
- Last: approximately 121.90,
- Bars: Medium,
- Mom: Momentum fast.
WSFG Weekly
- Near-Term
- WSFG Current: -95%
- F0%/NTZ' Bias: Price Below,
- WSFG Trend: Down.
MSFG Month Nov
- Medium-Term
- MSFG Current: -16%
- F0%/NTZ' Bias: Price Below,
- MSFG Trend: Down.
YSFG Year 2026
- Far-Term
- YSFG Current: -33%
- F0%/NTZ' Bias: Price Below,
- YSFG Trend: Down.
Swing Pivots
- (Near-Term) 1. Pvt. Trend: DTrend,
- (Medium-Term) 2. HiLo Trend: DTrend,
- 3. Pvt. Evolve: Pvt low 121.80,
- 4. Pvt. Next: Pvt high 123.10,
- 5. Levels R: 137.31, 136.68, 134.27, 133.53, 130.08,
- 6. Levels S: 121.80, 119.19.
Daily Benchmarks
- (Near-Term) 5 Day: 122.72 Down Trend,
- (Near-Term) 10 Day: 122.71 Down Trend,
- (Medium-Term) 20 Day: 122.27 Up Trend,
- (Medium-Term) 55 Day: 122.06 Up Trend,
- (Far-Term) 100 Day: 122.69 Down Trend,
- (Far-Term) 200 Day: 124.05 Down Trend.
Additional Metrics
Recent Trade Signals
- 13 Nov 2026: Short FGBL 12-26 @ 121.93 Signals.USAR-MSFG
- 10 Nov 2026: Short FGBL 12-26 @ 122.68 Signals.USAR.TR120
- 09 Nov 2026: Short FGBL 12-26 @ 122.93 Signals.USAR-WSFG
Overall Rating
- Near-Term: Bearish,
- Medium-Term: Bearish,
- Far-Term: Bearish.
Key Insights Summary
The October recovery from 119.19 stalled at 123.53, producing a lower swing high within the broader declining structure. The subsequent rapid pullback has carried price below all six benchmarks and beneath November’s neutral zone, with the evolving 121.80 pivot low marking the immediate support test. Near-term weakness is reinforced by falling 5- and 10-day averages and three successive short signals. Medium-term conditions remain mixed beneath the bearish rating because the 20- and 55-day averages still slope upward, although price has undercut both. Falling 100- and 200-day averages and the negative yearly grid maintain the bearish far-term backdrop. The Swing Pivots summary lists resistance levels that differ from the visible chart annotations at 123.53, 124.68 and 126.86; the summary values are reproduced above as requested. No news or seasonal catalyst is established by this chart.
Chart Analysis ATS AI Generated: 2026-11-13 15:06 for Informational use only, not trading advice. Terms and Risk Disclosure Copyright © 2026. Algo Trading Systems LLC.