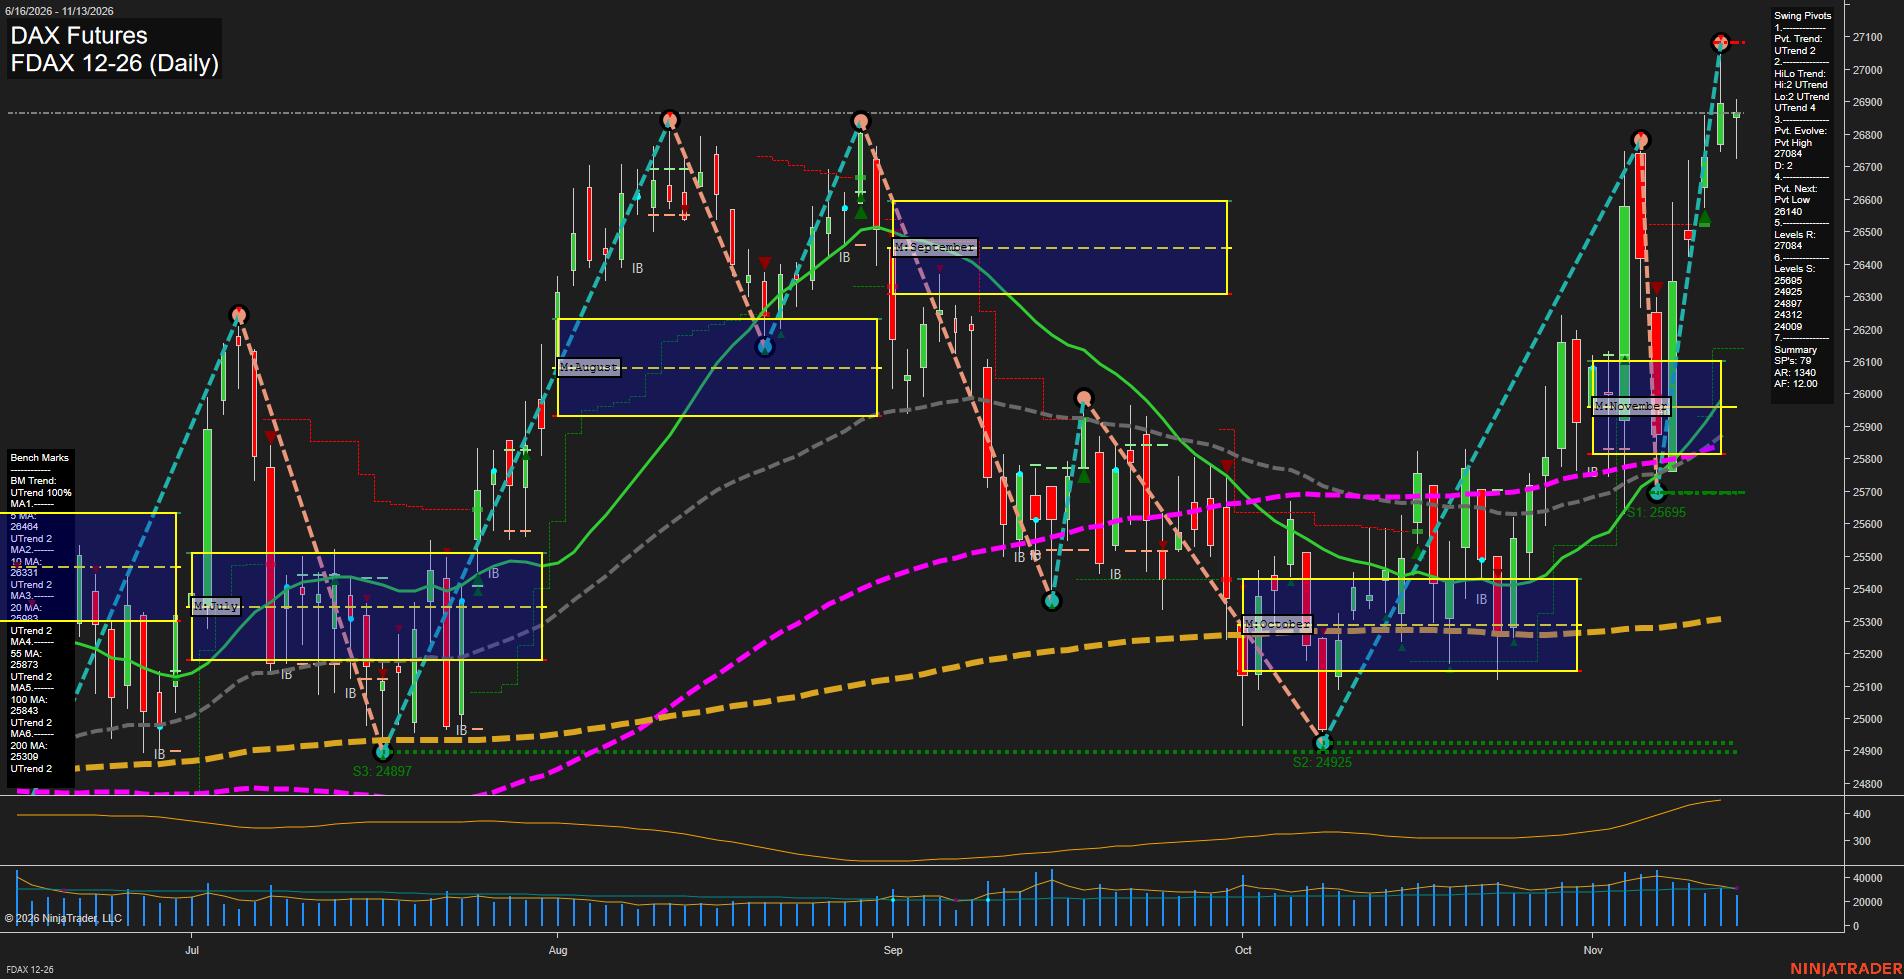
FDAX DAX Futures Daily Chart Analysis — After Market Close: 2026-Nov-13 15:05 CT
Price Action
- Last: approximately 26860,
- Bars: Large,
- Mom: Momentum fast.
WSFG Weekly
- Near-Term
- WSFG Current: 133%
- F0%/NTZ' Bias: Price Above,
- WSFG Trend: Up.
MSFG Month Nov
- Medium-Term
- MSFG Current: 81%
- F0%/NTZ' Bias: Price Above,
- MSFG Trend: Up.
YSFG Year 2026
- Far-Term
- YSFG Current: 53%
- F0%/NTZ' Bias: Price Above,
- YSFG Trend: Up.
Swing Pivots
- (Near-Term) 1. Pvt. Trend: UTrend,
- (Medium-Term) 2. HiLo Trend: UTrend,
- 3. Pvt. Evolve: Pvt high 27084,
- 4. Pvt. Next: Pvt low 26140,
- 5. Levels R: 27084,
- 6. Levels S: 25695, 24925, 24897, 24312, 24009.
Daily Benchmarks
- (Near-Term) 5 Day: 26484 Up Trend,
- (Near-Term) 10 Day: 26331 Up Trend,
- (Medium-Term) 20 Day: 25983 Up Trend,
- (Medium-Term) 55 Day: 25873 Up Trend,
- (Far-Term) 100 Day: 25843 Up Trend,
- (Far-Term) 200 Day: 25309 Up Trend.
Additional Metrics
Recent Trade Signals
- 06 Nov 2026: Short FDAX 12-26 @ 25803 Signals.USAR-MSFG
- 06 Nov 2026: Short FDAX 12-26 @ 25803 Signals.USAR-WSFG
Overall Rating
- Near-Term: Bullish,
- Medium-Term: Bullish,
- Far-Term: Bullish.
Key Insights Summary
From a futures swing-trading perspective, FDAX shows a strong trend-continuation rally following October’s recovery and a sharp November pullback. Higher swing highs and higher swing lows, price above all six rising benchmarks, and positive session-grid positioning establish broad bullish alignment. The recovery from 25695 has carried price above the August–September highs toward resistance at 27084. The latest small-bodied session indicates a pause beneath that high after several large directional bars, rather than a confirmed bearish reversal. The next opposite-pivot threshold is 26140; established swing support begins at 25695. ATR of 397 reflects substantial daily movement. The November 6 short signals oppose the current bullish structure, and price is now materially above their 25803 reference. No additional signal types or news catalysts are established by the supplied chart.
Chart Analysis ATS AI Generated: 2026-11-13 15:05 for Informational use only, not trading advice. Terms and Risk Disclosure Copyright © 2026. Algo Trading Systems LLC.