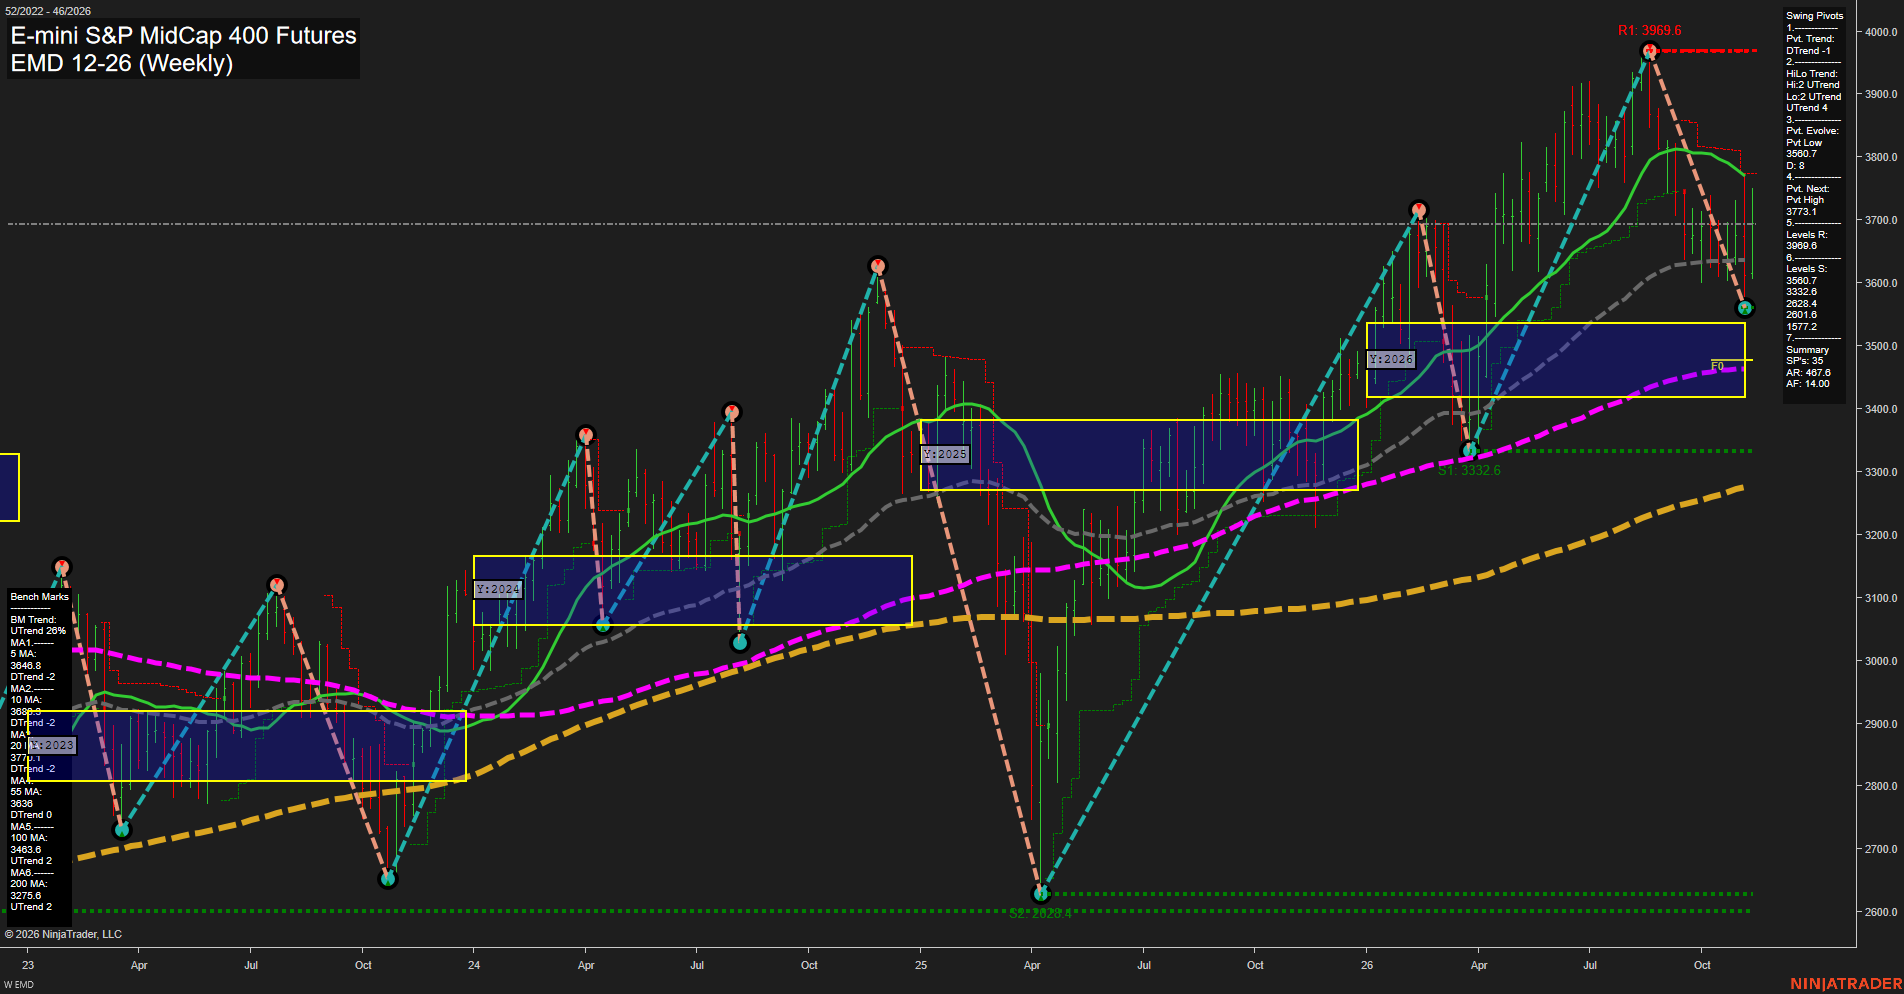
EMD E-mini S&P MidCap 400 Futures Weekly Chart Analysis — After Market Close: 2026-Nov-13 15:04 CT
Price Action
- Last: Approximately 3695,
- Bars: Large,
- Mom: Momentum average.
WSFG Weekly
- Near-Term
- WSFG Current: 64%
- F0%/NTZ' Bias: Price Above,
- WSFG Trend: Up.
MSFG Month Nov
- Medium-Term
- MSFG Current: 11%
- F0%/NTZ' Bias: Price Above,
- MSFG Trend: Up.
YSFG Year 2026
- Far-Term
- YSFG Current: 36%
- F0%/NTZ' Bias: Price Above,
- YSFG Trend: Up.
Swing Pivots
- (Near-Term) 1. Pvt. Trend: DTrend,
- (Medium-Term) 2. HiLo Trend: UTrend,
- 3. Pvt. Evolve: Pvt low 3560.7,
- 4. Pvt. Next: Pvt high 3773.1,
- 5. Levels R: 3969.6,
- 6. Levels S: 3560.7, 3332.6, 2628.4, 2601.6, 1577.2.
Weekly Benchmarks
- (Near-Term) 5 Week: 3646.8 Down Trend,
- (Near-Term) 10 Week: 3689.3 Down Trend,
- (Medium-Term) 20 Week: 3773.1 Down Trend,
- (Medium-Term) 55 Week: Approximately 3636 Down Trend,
- (Far-Term) 100 Week: 3463.6 Up Trend,
- (Far-Term) 200 Week: 3275.6 Up Trend.
Recent Trade Signals
- 12 Nov 2026: Short EMD 12-26 @ 3697.7 Signals.USAR.TR120
- 09 Nov 2026: Long EMD 12-26 @ 3625 Signals.USAR-WSFG
Overall Rating
- Near-Term: Bearish,
- Medium-Term: Neutral,
- Far-Term: Bullish.
Key Insights Summary
The weekly chart shows a rebound within the correction from 3969.6 to the evolving 3560.7 pivot low, rather than a confirmed near-term trend reversal. Price has recovered above the declining 5- and 10-week benchmarks but remains below the 20-week benchmark near 3773.1, which also matches the next pivot-reversal threshold. Upward weekly and monthly grid readings contrast with the declining near-term pivot trend and the newer short signal, indicating a contested recovery with substantial weekly ranges. The medium-term higher-high/higher-low structure remains intact above 3332.6, while rising 100- and 200-week benchmarks support the broader bullish structure. The yearly NTZ below current price provides additional context for this being a pullback within a longer-term advance. No medium- or far-term trade signals, news catalysts, or seasonal evidence are supplied, so those factors are not independently confirmed.
Chart Analysis ATS AI Generated: 2026-11-13 15:04 for Informational use only, not trading advice. Terms and Risk Disclosure Copyright © 2026. Algo Trading Systems LLC.