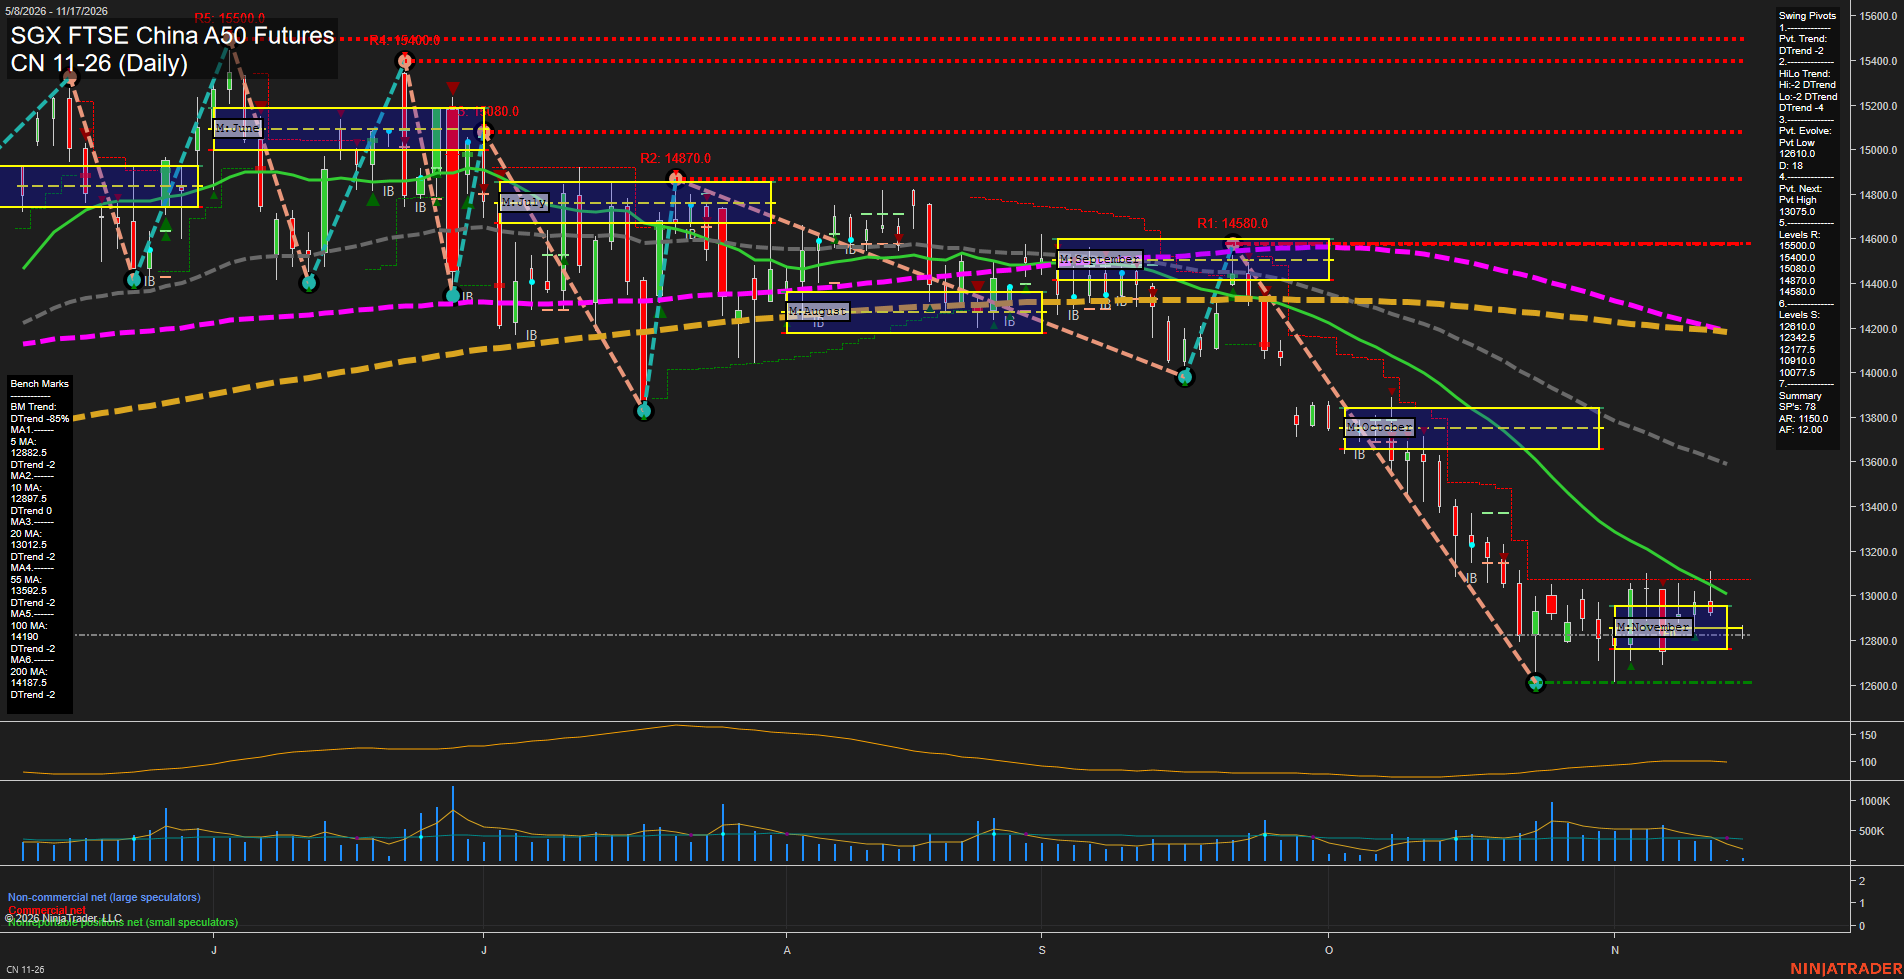
CN SGX FTSE China A50 Futures Daily Chart Analysis — After Market Close: 2026-Nov-13 15:03 CT
Price Action
- Last: Approximately 12830,
- Bars: Small,
- Mom: Momentum slow.
WSFG Weekly
- Near-Term
- WSFG Current: NA%
- F0%/NTZ' Bias: Price Neutral,
- WSFG Trend: Neutral.
MSFG Month Nov
- Medium-Term
- MSFG Current: NA%
- F0%/NTZ' Bias: Price Neutral,
- MSFG Trend: Neutral.
YSFG Year 2026
- Far-Term
- YSFG Current: NA%
- F0%/NTZ' Bias: Price Neutral,
- YSFG Trend: Neutral.
Swing Pivots
- (Near-Term) 1. Pvt. Trend: DTrend,
- (Medium-Term) 2. HiLo Trend: DTrend,
- 3. Pvt. Evolve: Pvt low 12610,
- 4. Pvt. Next: Pvt high 13075,
- 5. Levels R: 15500, 15400, 15080, 14870, 14580,
- 6. Levels S: 12610, 12342.5, 12177.5, 10910, 10077.5.
Daily Benchmarks
- (Near-Term) 5 Day: 12882.5 Down Trend,
- (Near-Term) 10 Day: 12897.5 Down Trend,
- (Medium-Term) 20 Day: 13012.5 Down Trend,
- (Medium-Term) 55 Day: 13592.5 Down Trend,
- (Far-Term) 100 Day: 14190 Down Trend,
- (Far-Term) 200 Day: 14187.5 Down Trend.
Additional Metrics
Overall Rating
- Near-Term: Bearish,
- Medium-Term: Bearish,
- Far-Term: Bearish.
Key Insights Summary
Price is consolidating near the November NTZ center after a pronounced September–October selloff. Smaller recent bodies and overlapping bars indicate slowing downside momentum, but not a confirmed trend reversal. Both pivot trends remain downward, with lower highs and lower lows defining the broader swing structure. The evolving 12610 low anchors support, while 13075 is the summary's next-pivot reversal threshold. Price remains below all six benchmarks, and the benchmark summary reports an 85% downward trend reading. The 20-day average near 13012.5 represents nearby overhead trend pressure; the 55-day near 13592.5 shows the larger distance to medium-term recovery. November's neutral grid positioning therefore reflects local consolidation within a bearish broader structure. Weekly and yearly grids and the named USAR signal readings are not displayed, so their directional signals cannot be independently verified. The chart alone does not establish news or seasonal drivers.
Chart Analysis ATS AI Generated: 2026-11-13 15:03 for Informational use only, not trading advice. Terms and Risk Disclosure Copyright © 2026. Algo Trading Systems LLC.