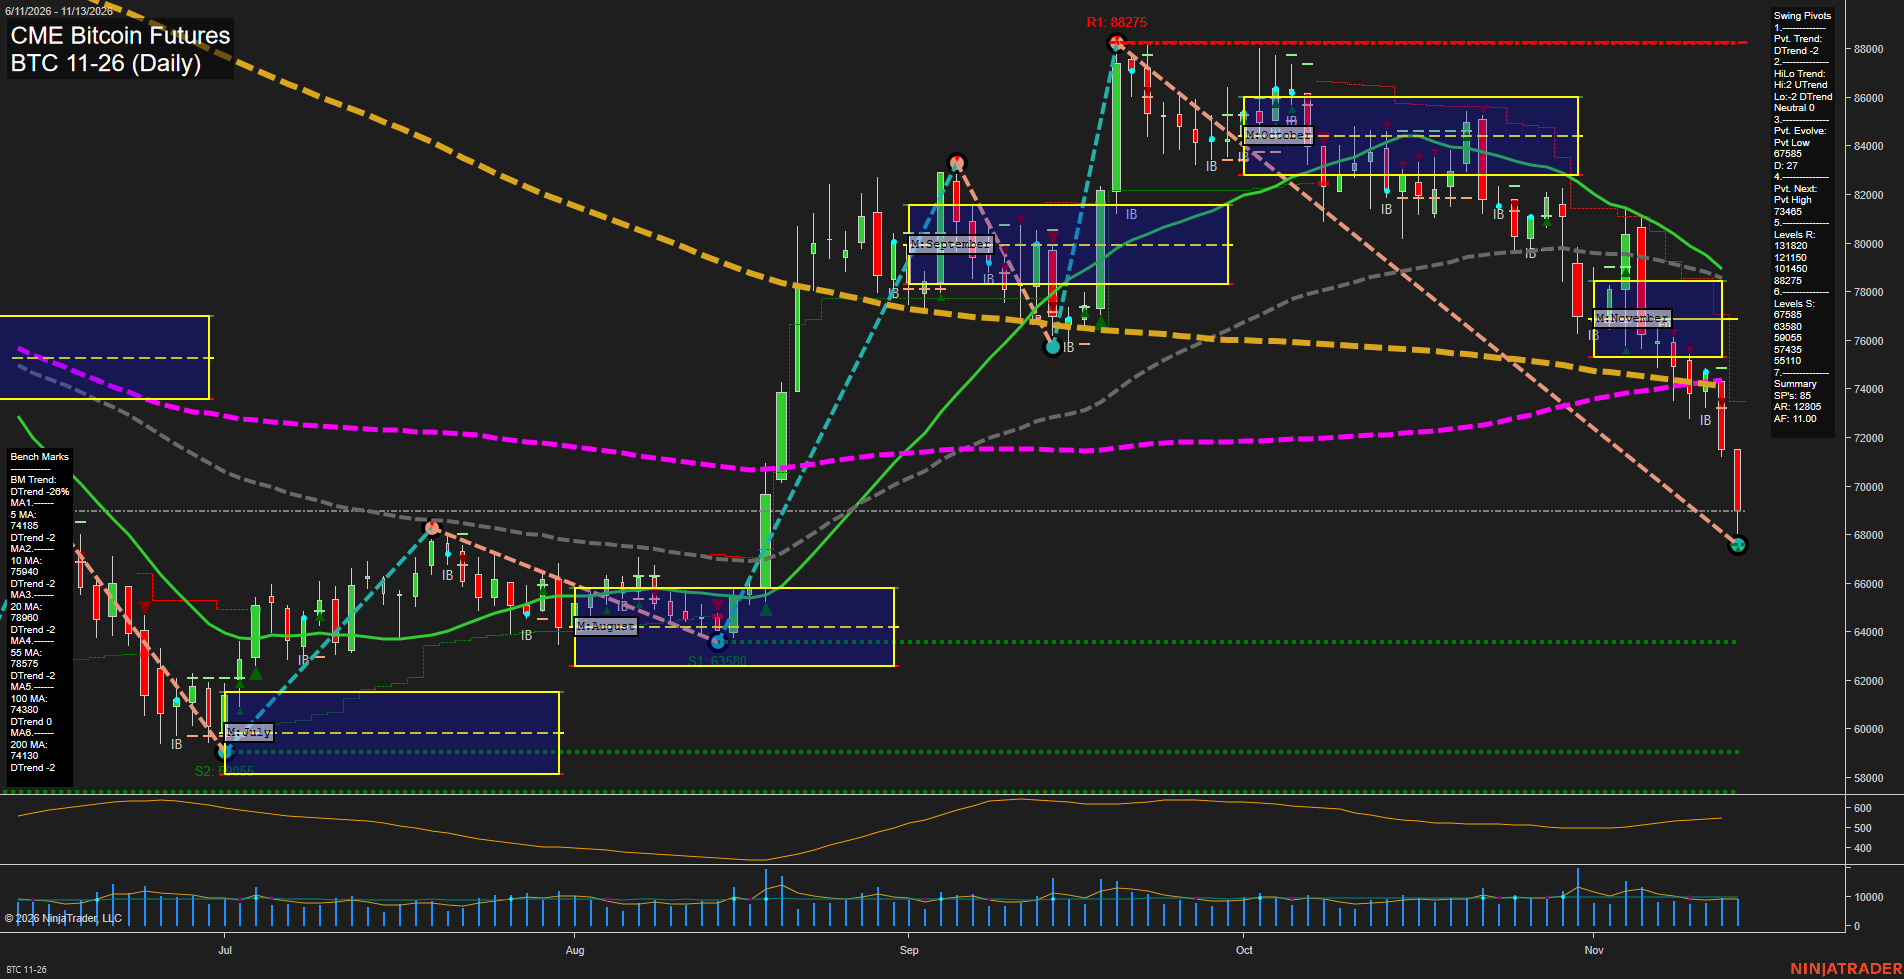
BTC CME Bitcoin Futures Daily Chart Analysis — After Market Close: 2026-Nov-13 15:02 CT
Price Action
- Last: Approximately 69000,
- Bars: Large,
- Mom: Momentum fast.
WSFG Weekly
- Near-Term
- WSFG Current: -129%
- F0%/NTZ' Bias: Price Below,
- WSFG Trend: Down.
MSFG Month Nov
- Medium-Term
- MSFG Current: -62%
- F0%/NTZ' Bias: Price Below,
- MSFG Trend: Down.
YSFG Year 2026
- Far-Term
- YSFG Current: -78%
- F0%/NTZ' Bias: Price Below,
- YSFG Trend: Down.
Swing Pivots
- (Near-Term) 1. Pvt. Trend: DTrend,
- (Medium-Term) 2. HiLo Trend: Neutral,
- 3. Pvt. Evolve: Pvt low 67585,
- 4. Pvt. Next: Pvt high 73465,
- 5. Levels R: 131820, 121150, 101450, 88275,
- 6. Levels S: 67585, 63580, 59055, 57435, 55110.
Daily Benchmarks
- (Near-Term) 5 Day: 74185 Down Trend,
- (Near-Term) 10 Day: 75940 Down Trend,
- (Medium-Term) 20 Day: 78960 Down Trend,
- (Medium-Term) 55 Day: 78575 Down Trend,
- (Far-Term) 100 Day: 74380 Down Trend,
- (Far-Term) 200 Day: 74130 Down Trend.
Additional Metrics
Recent Trade Signals
- 09 Nov 2026: Short BTC 11-26 @ 74740 Signals.USAR-MSFG
Overall Rating
- Near-Term: Bearish,
- Medium-Term: Bearish,
- Far-Term: Bearish.
Key Insights Summary
From a futures swing-trading perspective, the chart shows accelerating downside continuation after rejection from the November consolidation. Large bearish candles have carried price beneath the monthly NTZ and all six daily benchmarks, with weekly, monthly and yearly grids aligned downward. The evolving pivot low at 67585 marks the immediate swing reference, followed by established support at 63580 and 59055. The 74130–74380 benchmark cluster now sits overhead. Although the medium-term HiLo pivot summary remains neutral because its high and low trends diverge, falling medium-term averages and the monthly short signal favor a bearish overall interpretation. The decline from 88275 has substantially retraced the preceding rally; the latest bars show selling pressure rather than a confirmed base or reversal. News and seasonal influences cannot be established from this chart alone.
Chart Analysis ATS AI Generated: 2026-11-13 15:02 for Informational use only, not trading advice. Terms and Risk Disclosure Copyright © 2026. Algo Trading Systems LLC.