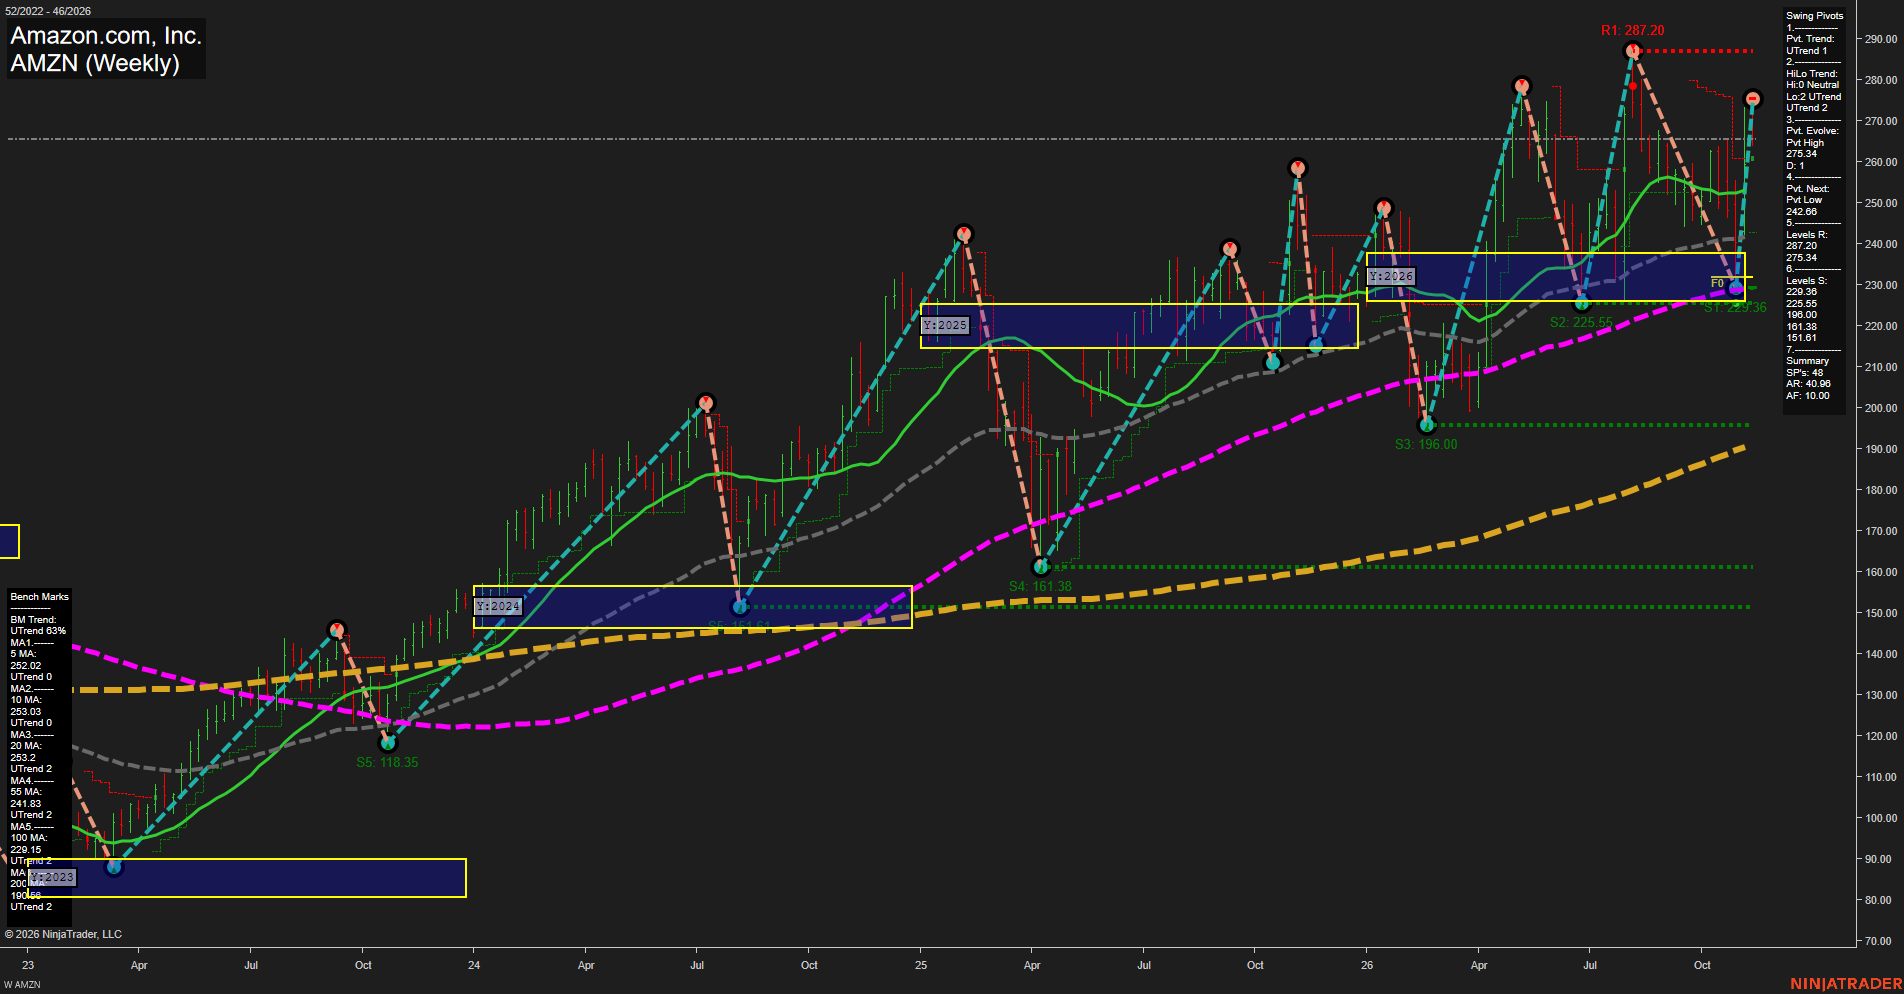
AMZN Amazon.com; Inc. Weekly Chart Analysis — After Market Close: 2026-Nov-13 15:02 CT
Price Action
- Last: Approximately 265.50,
- Bars: Large,
- Mom: Momentum fast.
WSFG Weekly
- Near-Term
- WSFG Current: NA%
- F0%/NTZ' Bias: Price Neutral,
- WSFG Trend: Neutral.
MSFG Month Nov
- Medium-Term
- MSFG Current: NA%
- F0%/NTZ' Bias: Price Neutral,
- MSFG Trend: Neutral.
YSFG Year 2026
- Far-Term
- YSFG Current: NA%
- F0%/NTZ' Bias: Price above F0% and NTZ,
- YSFG Trend: Bullish.
Swing Pivots
- (Near-Term) 1. Pvt. Trend: UTrend,
- (Medium-Term) 2. HiLo Trend: UTrend,
- 3. Pvt. Evolve: Pvt high 275.34,
- 4. Pvt. Next: Pvt low 242.66,
- 5. Levels R: 287.20, 275.34,
- 6. Levels S: 229.36, 225.55, 196.00, 161.38, 151.61.
Weekly Benchmarks
- (Near-Term) 5 Week: 252.02 Up Trend,
- (Near-Term) 10 Week: 253.03 Up Trend,
- (Medium-Term) 20 Week: 253.20 Up Trend,
- (Medium-Term) 55 Week: 241.83 Up Trend,
- (Far-Term) 100 Week: 229.15 Up Trend,
- (Far-Term) 200 Week: 190.68 Up Trend.
Overall Rating
- Near-Term: Bullish,
- Medium-Term: Bullish,
- Far-Term: Bullish.
Key Insights Summary
From a futures swing trader’s perspective, this equity chart shows a fast recovery from 229.36 into an evolving 275.34 pivot high, followed by a retreat toward 265.50. Price remains above all six rising benchmarks, supporting bullish alignment across time frames. The tightly grouped 5-, 10-, and 20-week averages around 252–253 form a notable trend-reference cluster. The recovery has not exceeded the prior 287.20 peak, leaving overhead resistance despite strong rebound momentum. The pivot summary identifies 242.66 as the next downside pivot-reversal threshold, distinct from established support. Wide recent weekly ranges indicate substantial two-way volatility rather than a smooth advance. Weekly and monthly grids and the requested recent signal series are not displayed; their neutral placeholders are unconfirmed, and ratings reflect the visible pivots, benchmarks, and yearly grid. No news or seasonal catalyst can be established from this chart alone.
Chart Analysis ATS AI Generated: 2026-11-13 15:02 for Informational use only, not trading advice. Terms and Risk Disclosure Copyright © 2026. Algo Trading Systems LLC.