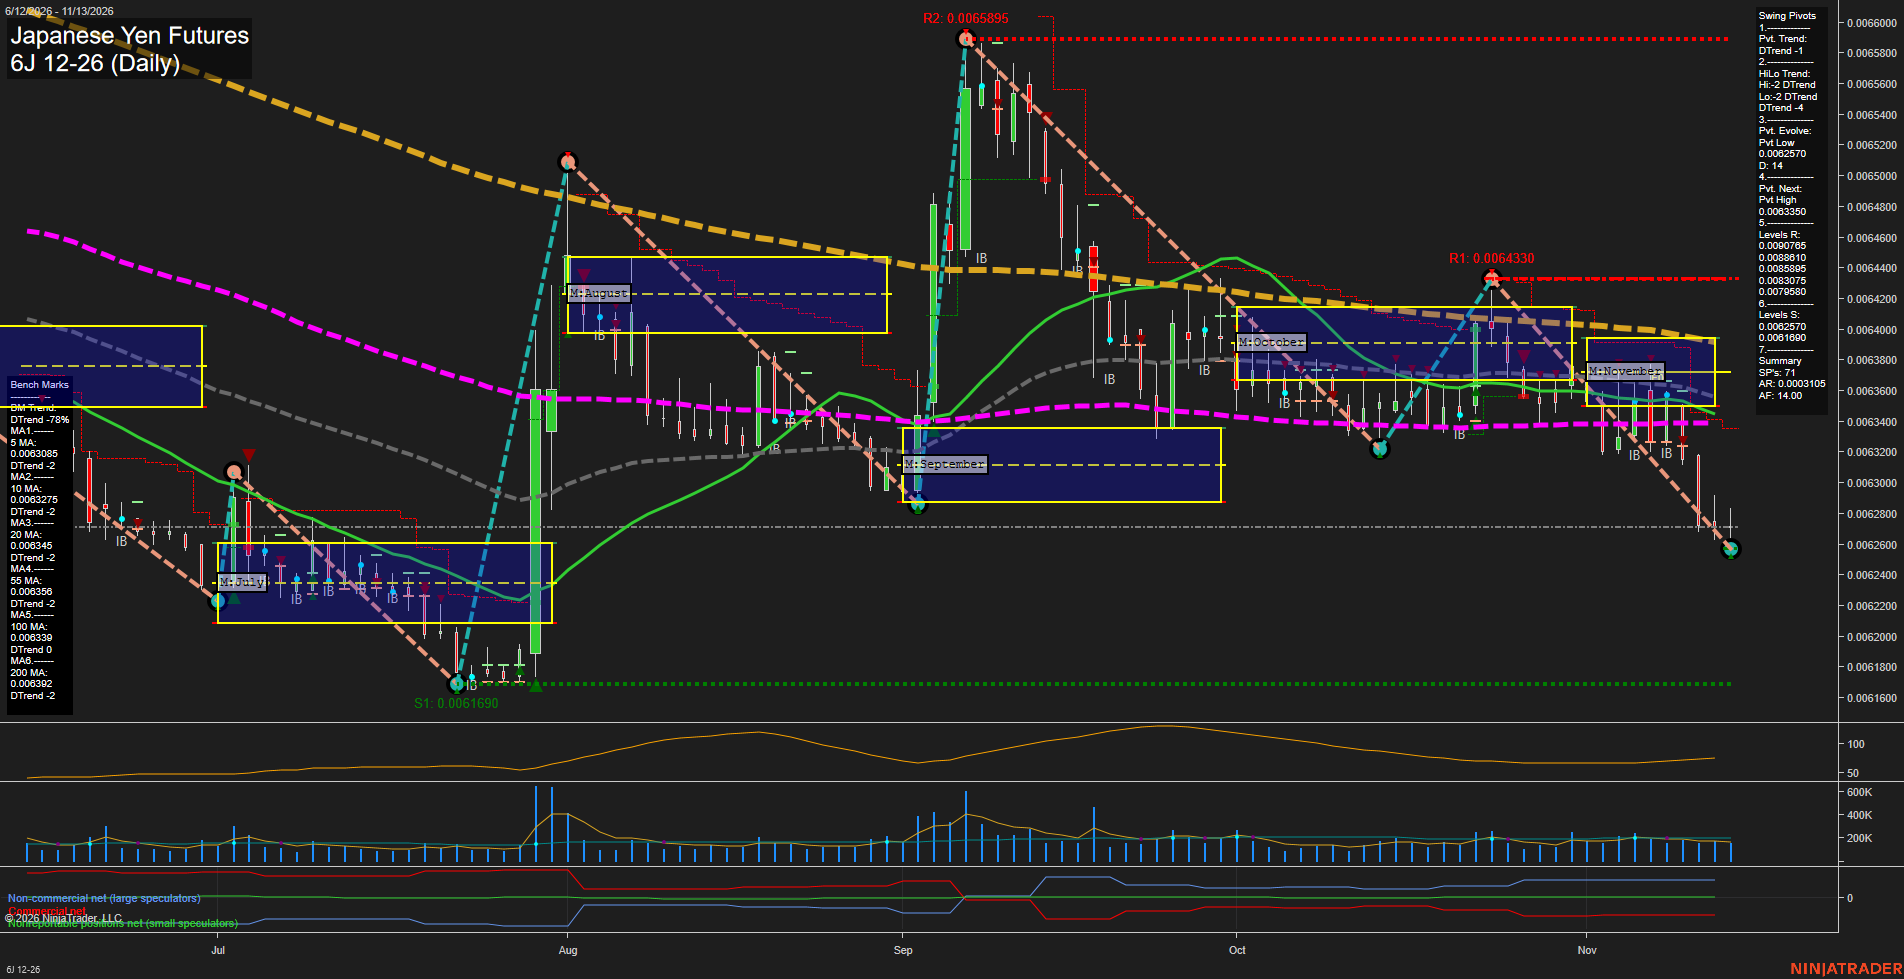
6J Japanese Yen Futures Daily Chart Analysis — After Market Close: 2026-Nov-13 15:01 CT
Price Action
- Last: Approximately 0.0062720,
- Bars: Medium,
- Mom: Momentum fast.
WSFG Weekly
- Near-Term
- WSFG Current: -80%
- F0%/NTZ' Bias: Price Below,
- WSFG Trend: Down.
MSFG Month Nov
- Medium-Term
- MSFG Current: -45%
- F0%/NTZ' Bias: Price Below,
- MSFG Trend: Down.
YSFG Year 2026
- Far-Term
- YSFG Current: -27%
- F0%/NTZ' Bias: Price Below,
- YSFG Trend: Down.
Swing Pivots
- (Near-Term) 1. Pvt. Trend: DTrend,
- (Medium-Term) 2. HiLo Trend: DTrend,
- 3. Pvt. Evolve: Pvt low 0.0062570,
- 4. Pvt. Next: Pvt high 0.0063350,
- 5. Levels R: 0.0090765, 0.0088010, 0.0085895, 0.0083075, 0.0079580,
- 6. Levels S: 0.0062570, 0.0061690.
Daily Benchmarks
- (Near-Term) 5 Day: 0.0063085 Down Trend,
- (Near-Term) 10 Day: 0.0063275 Down Trend,
- (Medium-Term) 20 Day: 0.0063450 Down Trend,
- (Medium-Term) 55 Day: 0.0063560 Down Trend,
- (Far-Term) 100 Day: 0.0063389 Down Trend,
- (Far-Term) 200 Day: 0.0063920 Down Trend.
Additional Metrics
Recent Trade Signals
- 10 Nov 2026: Short 6J 12-26 @ 0.0063185 Signals.USAR-WSFG
- 10 Nov 2026: Short 6J 12-26 @ 0.0063185 Signals.USAR.TR120
Overall Rating
- Near-Term: Bearish,
- Medium-Term: Bearish,
- Far-Term: Bearish.
Key Insights Summary
The swing-trading picture is a bearish continuation following the late-October rebound and subsequent rejection. Lower pivot highs and lows, price beneath all six benchmarks, and negative weekly, monthly and yearly grid readings align across time horizons. The November selloff has broken below the monthly NTZ and October's swing low, with the evolving pivot low at 0.0062570 and deeper chart support at 0.0061690. The latest bar shows some recovery from its low, but no confirmed pivot reversal; the summary identifies 0.0063350 as the next opposite-pivot threshold. Both November 10 short signals remain directionally consistent with the decline. Recent volume does not display an exceptional liquidation spike, while ATR has turned modestly higher. The 100-day benchmark is nearly flat despite its negative trend designation, contrasting with the clearer weakness elsewhere. News catalysts and seasonal effects cannot be established from this chart alone.
Chart Analysis ATS AI Generated: 2026-11-13 15:01 for Informational use only, not trading advice. Terms and Risk Disclosure Copyright © 2026. Algo Trading Systems LLC.