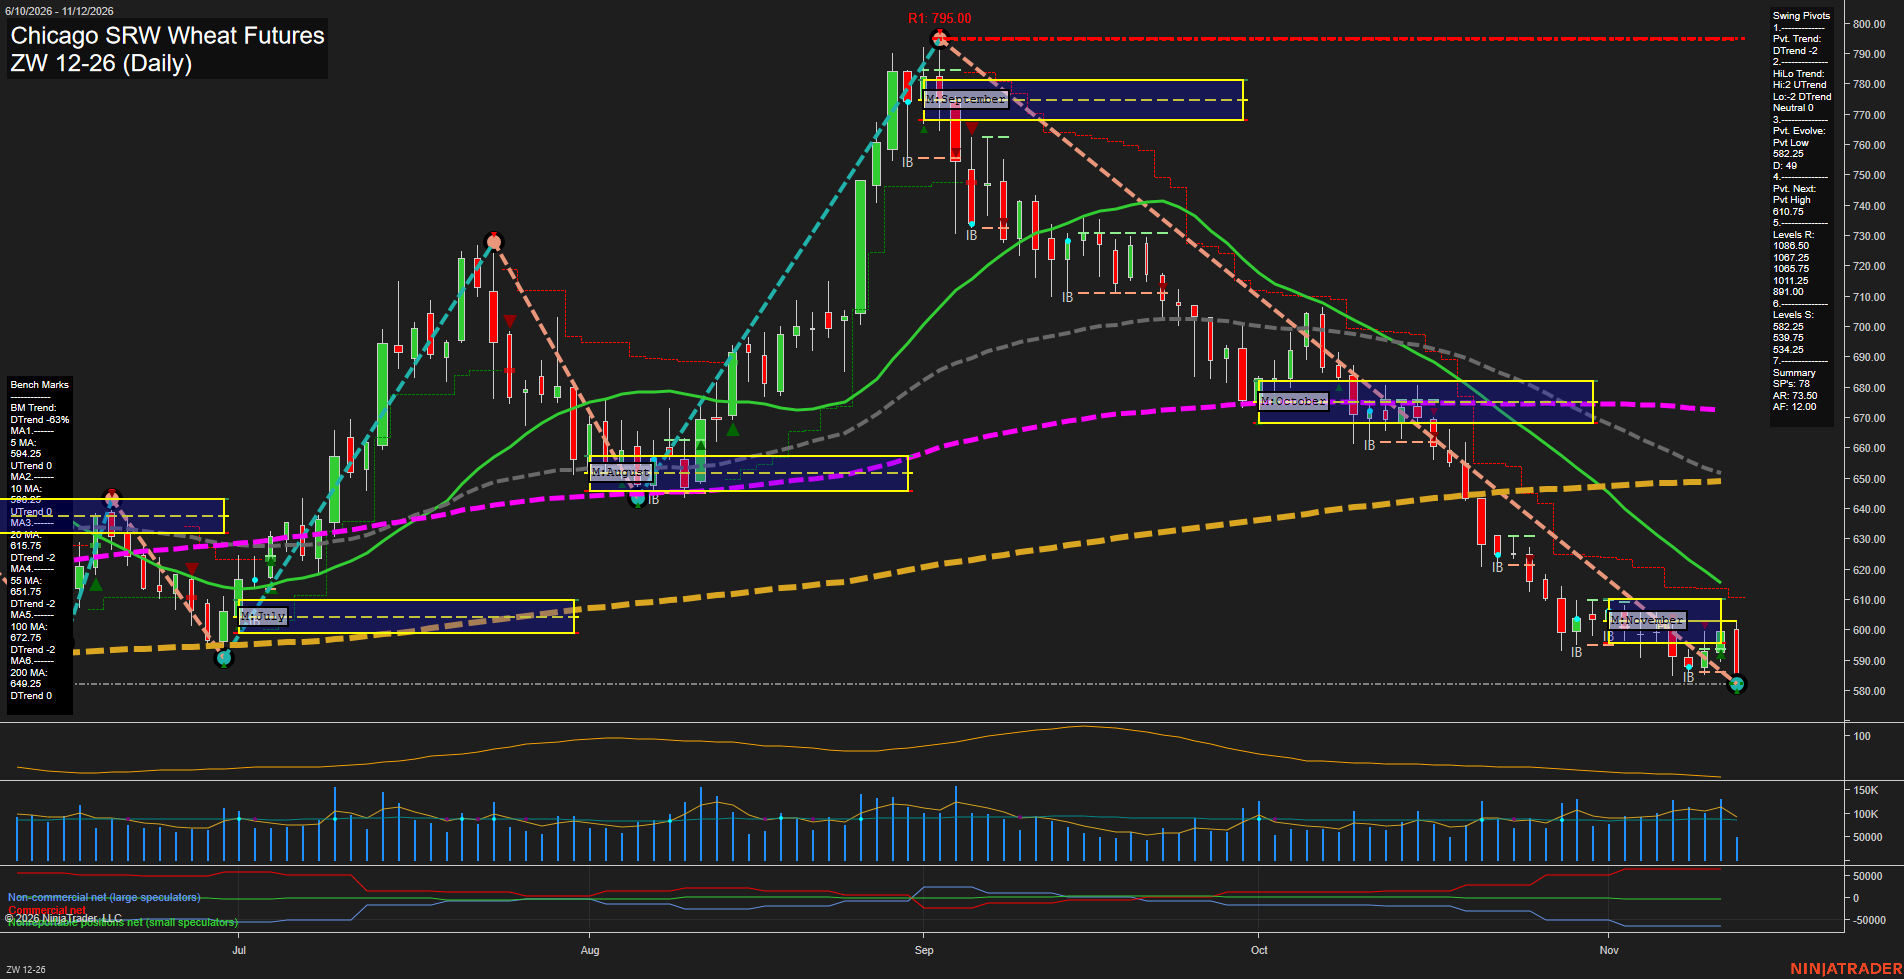
ZW Chicago SRW Wheat Futures Daily Chart Analysis: 2026-Nov-12 15:18 CT
Price Action
- Last: 582.25,
- Bars: Large,
- Mom: Momentum fast.
WSFG Weekly
- Short-Term
- WSFG Current: -26%
- F0%/NTZ' Bias: Price Below,
- WSFG Trend: Down.
MSFG Month Nov
- Intermediate-Term
- MSFG Current: -18%
- F0%/NTZ' Bias: Price Below,
- MSFG Trend: Down.
YSFG Year 2026
- Long-Term
- YSFG Current: 13%
- F0%/NTZ' Bias: Price Above,
- YSFG Trend: Up.
Swing Pivots
- (Short-Term) 1. Pvt. Trend: DTrend,
- (Intermediate-Term) 2. HiLo Trend: Neutral,
- 3. Pvt. Evolve: Pvt low 582.25,
- 4. Pvt. Next: Pvt high 610.75,
- 5. Levels R: 1086.50, 1067.25, 1065.75, 1011.25, 891.00,
- 6. Levels S: 582.25, 539.75, 534.25.
Daily Benchmarks
- (Short-Term) 5 Day: 594.25 Up Trend,
- (Short-Term) 10 Day: 598.25 Up Trend,
- (Intermediate-Term) 20 Day: 615.75 Down Trend,
- (Intermediate-Term) 55 Day: 651.75 Down Trend,
- (Long-Term) 100 Day: 672.75 Down Trend,
- (Long-Term) 200 Day: 649.25 Down Trend.
Additional Metrics
Recent Trade Signals
- 12 Nov 2026: Short ZW 12-26 @ 588.25 Signals.USAR-MSFG
- 12 Nov 2026: Long ZW 12-26 @ 597 Signals.USAR-WSFG
- 11 Nov 2026: Long ZW 12-26 @ 602.25 Signals.USAR.TR120
Overall Rating
- Short-Term: Neutral,
- Intermediate-Term: Bearish,
- Long-Term: Bearish.
Key Insights Summary
From a futures swing trader’s perspective, the dominant structure remains a sustained decline from September’s 795.00 high, with repeated lower highs and a developing pivot low at 582.25. The latest large bearish candle reverses the recent bounce and leaves price below every benchmark average and the weekly and monthly neutral zones. Short-term signals are divided between upward 5-day and 10-day benchmark readings and recent long signals versus the declining weekly grid and bearish pivot trend, producing a neutral aggregate rating with weak current price action. Intermediate-term evidence is predominantly bearish, including the monthly short signal and declining 20-day and 55-day benchmarks; the pivot summary nevertheless classifies the broader HiLo structure as neutral. The positive yearly grid contrasts with bearish long-term benchmarks. The evolving 582.25 low is the nearest listed support, while 610.75 is the next opposite-pivot threshold, not an established reversal. Recent buying signals therefore describe a countertrend bounce rather than a confirmed trend change. News catalysts and seasonal effects cannot be established from this chart alone.
Chart Analysis ATS AI Generated: 2026-11-12 15:18 for Informational use only, not trading advice. Terms and Risk Disclosure Copyright © 2026. Algo Trading Systems LLC.