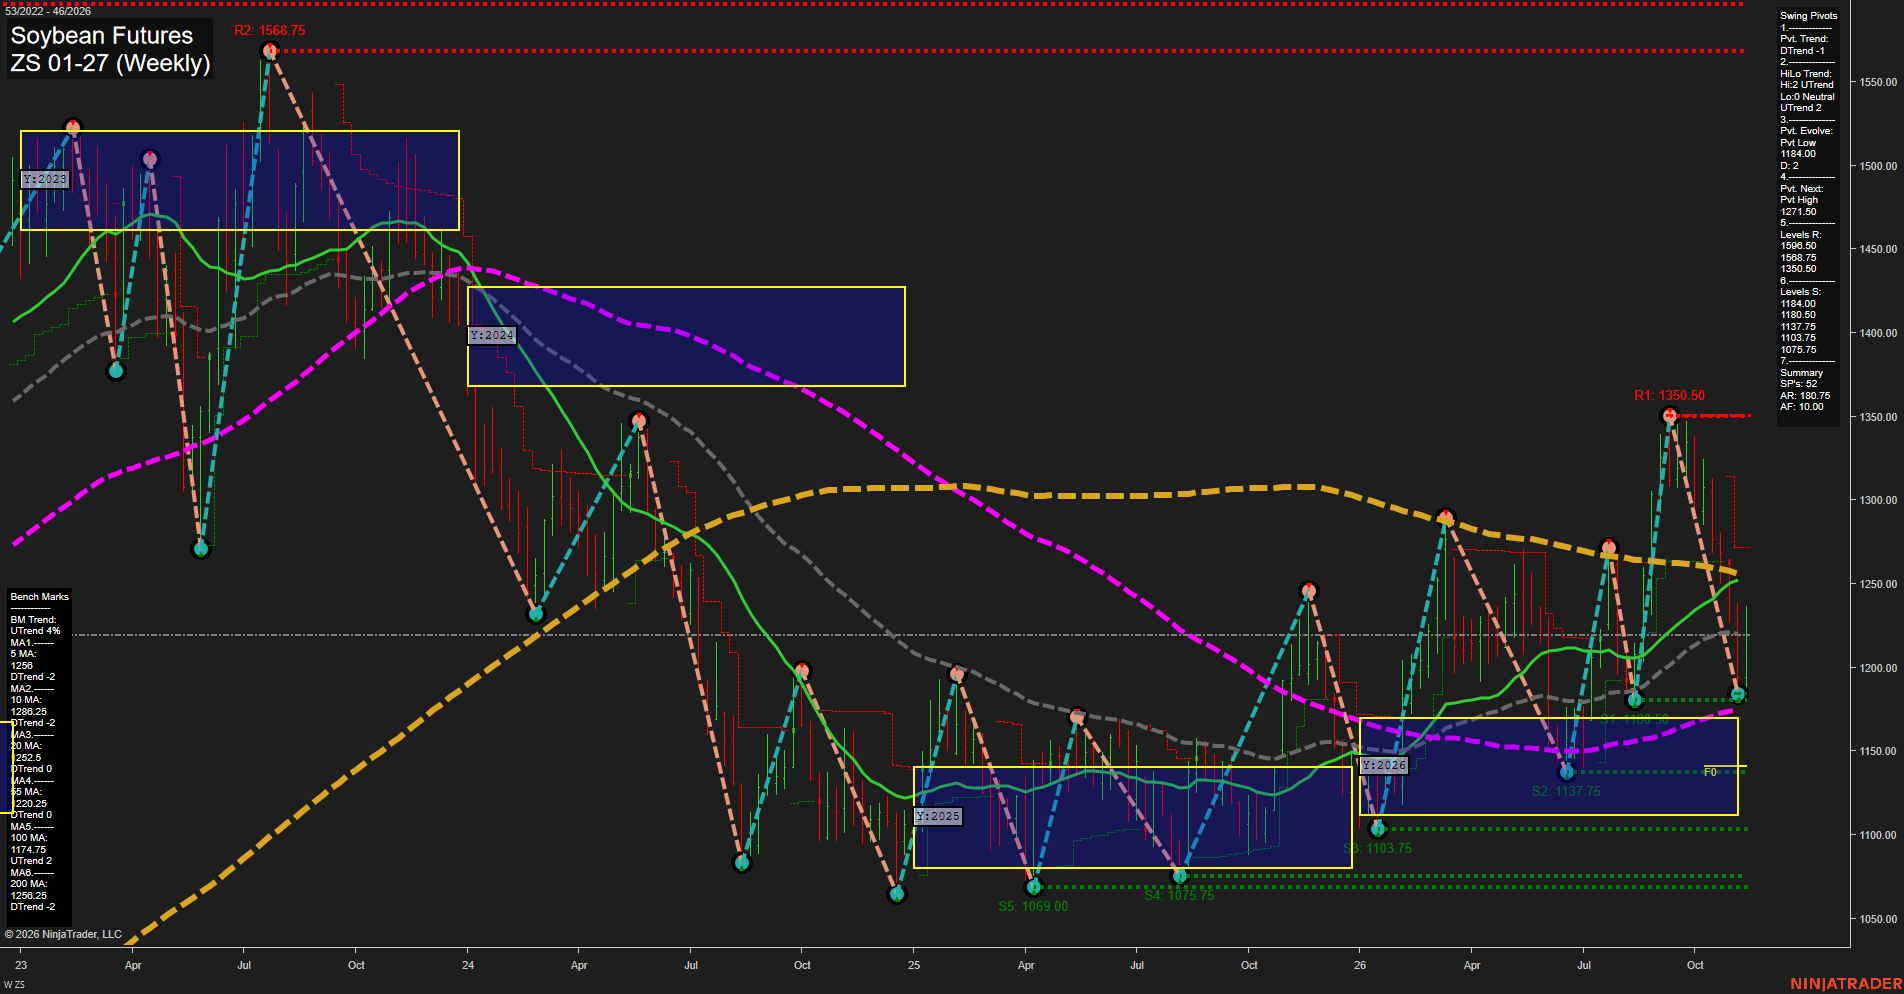
ZS Soybean Futures Weekly Chart Analysis: 2026-Nov-12 15:18 CT
Price Action
- Last: Not legible on the supplied chart,
- Bars: Large,
- Mom: Momentum fast on the recent downswing.
WSFG Weekly
- Short-Term
- WSFG Current: 63%
- F0%/NTZ' Bias: Price Above,
- WSFG Trend: Up.
MSFG Month Nov
- Intermediate-Term
- MSFG Current: -16%
- F0%/NTZ' Bias: Price Below,
- MSFG Trend: Down.
YSFG Year 2026
- Long-Term
- YSFG Current: 27%
- F0%/NTZ' Bias: Price Above,
- YSFG Trend: Up.
Swing Pivots
- (Short-Term) 1. Pvt. Trend: DTrend,
- (Intermediate-Term) 2. HiLo Trend: UTrend,
- 3. Pvt. Evolve: Pvt low 1184.00,
- 4. Pvt. Next: Pvt high 1271.50,
- 5. Levels R: 1596.50, 1568.75, 1350.50,
- 6. Levels S: 1184.00, 1180.50, 1137.75, 1103.75, 1075.75.
Weekly Benchmarks
- (Short-Term) 5 Day: 1256.00 Down Trend,
- (Short-Term) 10 Day: 1288.25 Down Trend,
- (Intermediate-Term) 20 Day: 1252.50 Up Trend,
- (Intermediate-Term) 55 Day: 1220.25 Up Trend,
- (Long-Term) 100 Day: 1174.75 Up Trend,
- (Long-Term) 200 Day: 1256.25 Down Trend.
Recent Trade Signals
- 10 Nov 2026: Long ZS 01-27 @ 1225.5 Signals.USAR.TR120
- 10 Nov 2026: Short ZS 01-27 @ 1188.25 Signals.USAR-WSFG
Overall Rating
- Short-Term: Bearish,
- Intermediate-Term: Bullish,
- Long-Term: Neutral.
Key Insights Summary
The weekly structure shows a sharp retracement from 1350.50 into the 1184.00–1180.50 support cluster, contrasting with the intermediate higher-high pivot structure. Short-term conditions lean bearish because the pivot trend and both fast benchmarks point down; the positive weekly grid and opposing recent signals show that momentum is not uniformly aligned. Intermediate conditions retain a bullish structural tilt through the HiLo uptrend and rising 20- and 55-period benchmarks, despite the negative monthly grid. Longer-term conditions remain mixed, with the positive yearly grid and rising 100-period benchmark offset by the declining 200-period benchmark. The yearly NTZ sits below the developing pivot low, while 1271.50 is the stated opposite-pivot reversal threshold. Overall, this is a volatile pullback within a broader recovery rather than a synchronized trend across timeframes. The image does not establish a news catalyst or seasonal driver.
Chart Analysis ATS AI Generated: 2026-11-12 15:18 for Informational use only, not trading advice. Terms and Risk Disclosure Copyright © 2026. Algo Trading Systems LLC.