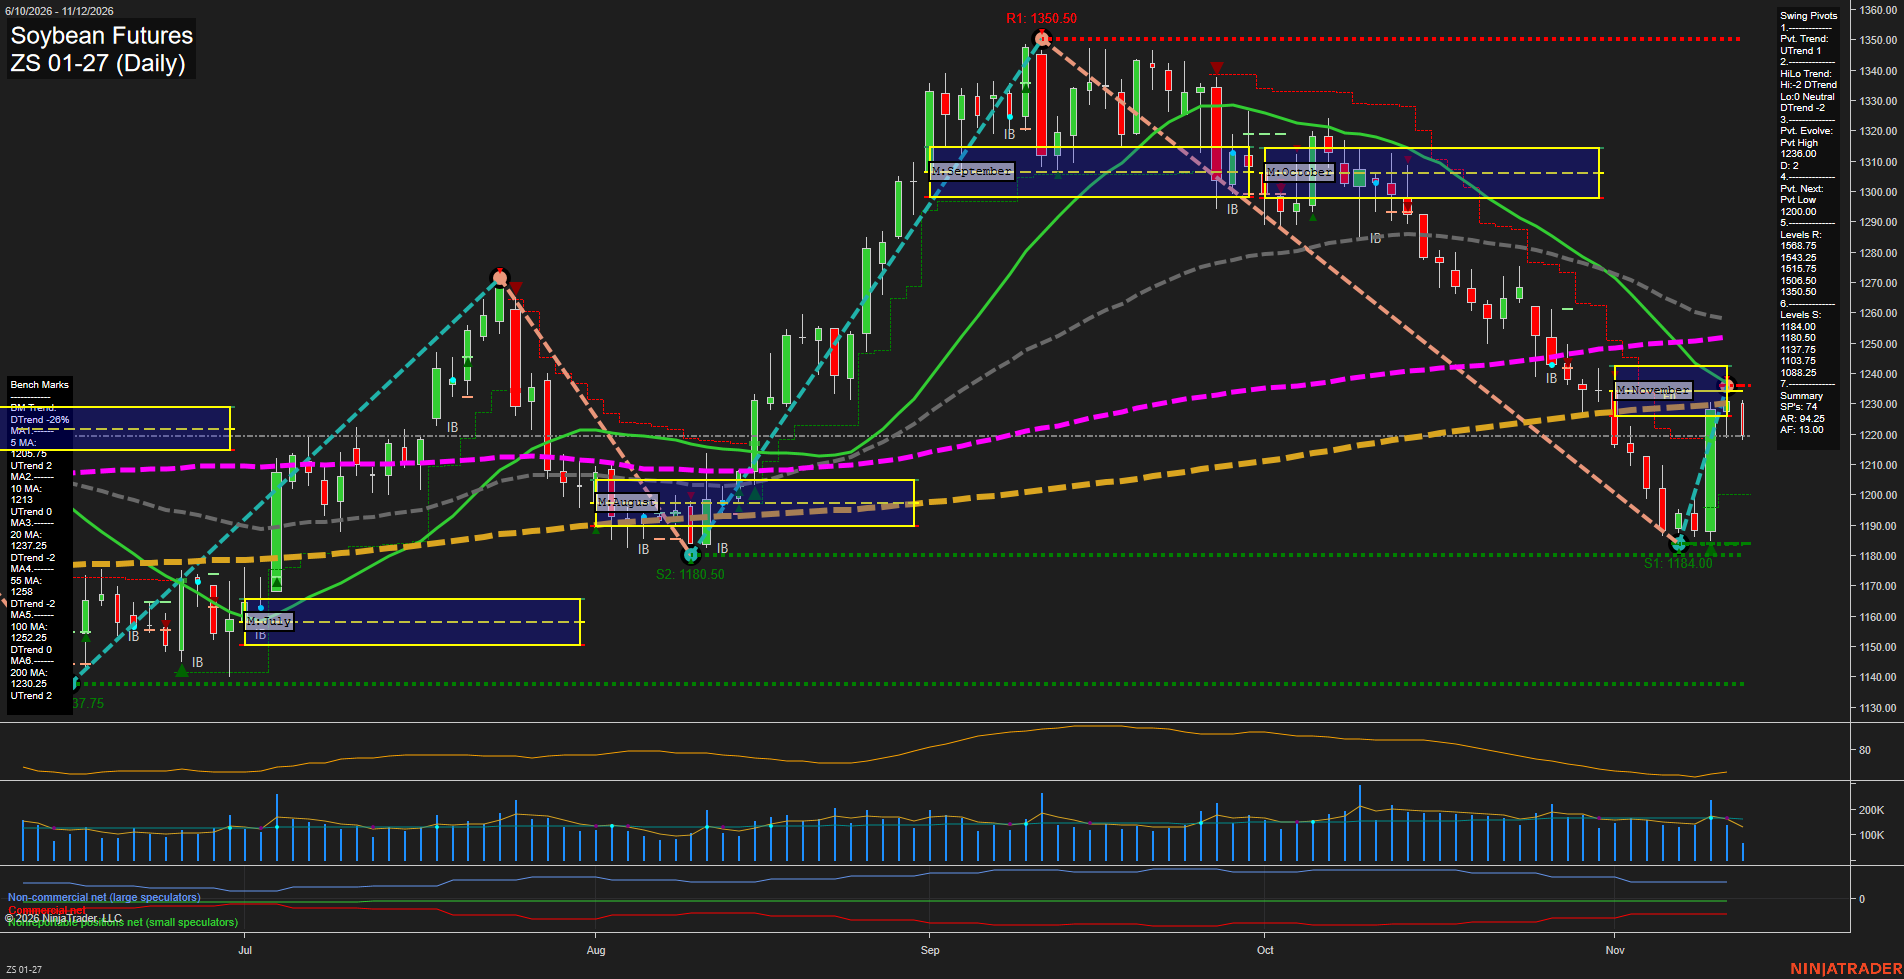
ZS Soybean Futures Daily Chart Analysis: 2026-Nov-12 15:17 CT
Price Action
- Last: Approximately 1219.75,
- Bars: Medium,
- Mom: Momentum fast.
WSFG Weekly
- Short-Term
- WSFG Current: 63%
- F0%/NTZ' Bias: Price Above,
- WSFG Trend: Up.
MSFG Month Nov
- Intermediate-Term
- MSFG Current: -16%
- F0%/NTZ' Bias: Price Below,
- MSFG Trend: Down.
YSFG Year 2026
- Long-Term
- YSFG Current: 27%
- F0%/NTZ' Bias: Price Above,
- YSFG Trend: Up.
Swing Pivots
- (Short-Term) 1. Pvt. Trend: UTrend,
- (Intermediate-Term) 2. HiLo Trend: DTrend,
- 3. Pvt. Evolve: Pvt high 1236.00,
- 4. Pvt. Next: Pvt low 1200.00,
- 5. Levels R: 1568.75, 1543.25, 1515.75, 1506.50, 1350.50,
- 6. Levels S: 1184.00, 1180.50, 1137.75, 1103.75, 1088.25.
Daily Benchmarks
- (Short-Term) 5 Day: 1205.75 Up Trend,
- (Short-Term) 10 Day: 1213 Up Trend,
- (Intermediate-Term) 20 Day: 1237.25 Down Trend,
- (Intermediate-Term) 55 Day: 1258 Down Trend,
- (Long-Term) 100 Day: 1252.25 Down Trend,
- (Long-Term) 200 Day: 1230.25 Up Trend.
Additional Metrics
Recent Trade Signals
- 10 Nov 2026: Long ZS 01-27 @ 1225.5 Signals.USAR.TR120
- 10 Nov 2026: Short ZS 01-27 @ 1188.25 Signals.USAR-WSFG
Overall Rating
- Short-Term: Bullish,
- Intermediate-Term: Bearish,
- Long-Term: Neutral.
Key Insights Summary
The sharp rebound from 1184.00 to an evolving pivot high at 1236.00 represents a short-term recovery within the broader decline from 1350.50. Price remains above the rising 5- and 10-day benchmarks, supporting the bullish short-term rating, but the latest retreat below the November NTZ shows that rebound momentum has stalled. The 1230.25–1237.25 area combines the rising 200-day benchmark, evolving pivot high and falling 20-day benchmark, forming a nearby technical resistance cluster. The declining 55-day benchmark at 1258 and bearish intermediate pivot structure retain the larger corrective character. Support at 1184.00 and 1180.50 forms a closely spaced floor. Conflicting recent long and short signals highlight the difference between the fast rebound and the prevailing intermediate downtrend. Long-term evidence is mixed, with a positive yearly grid and rising 200-day benchmark offset by price below both long-term averages. The chart alone does not establish a news or seasonal catalyst.
Chart Analysis ATS AI Generated: 2026-11-12 15:18 for Informational use only, not trading advice. Terms and Risk Disclosure Copyright © 2026. Algo Trading Systems LLC.