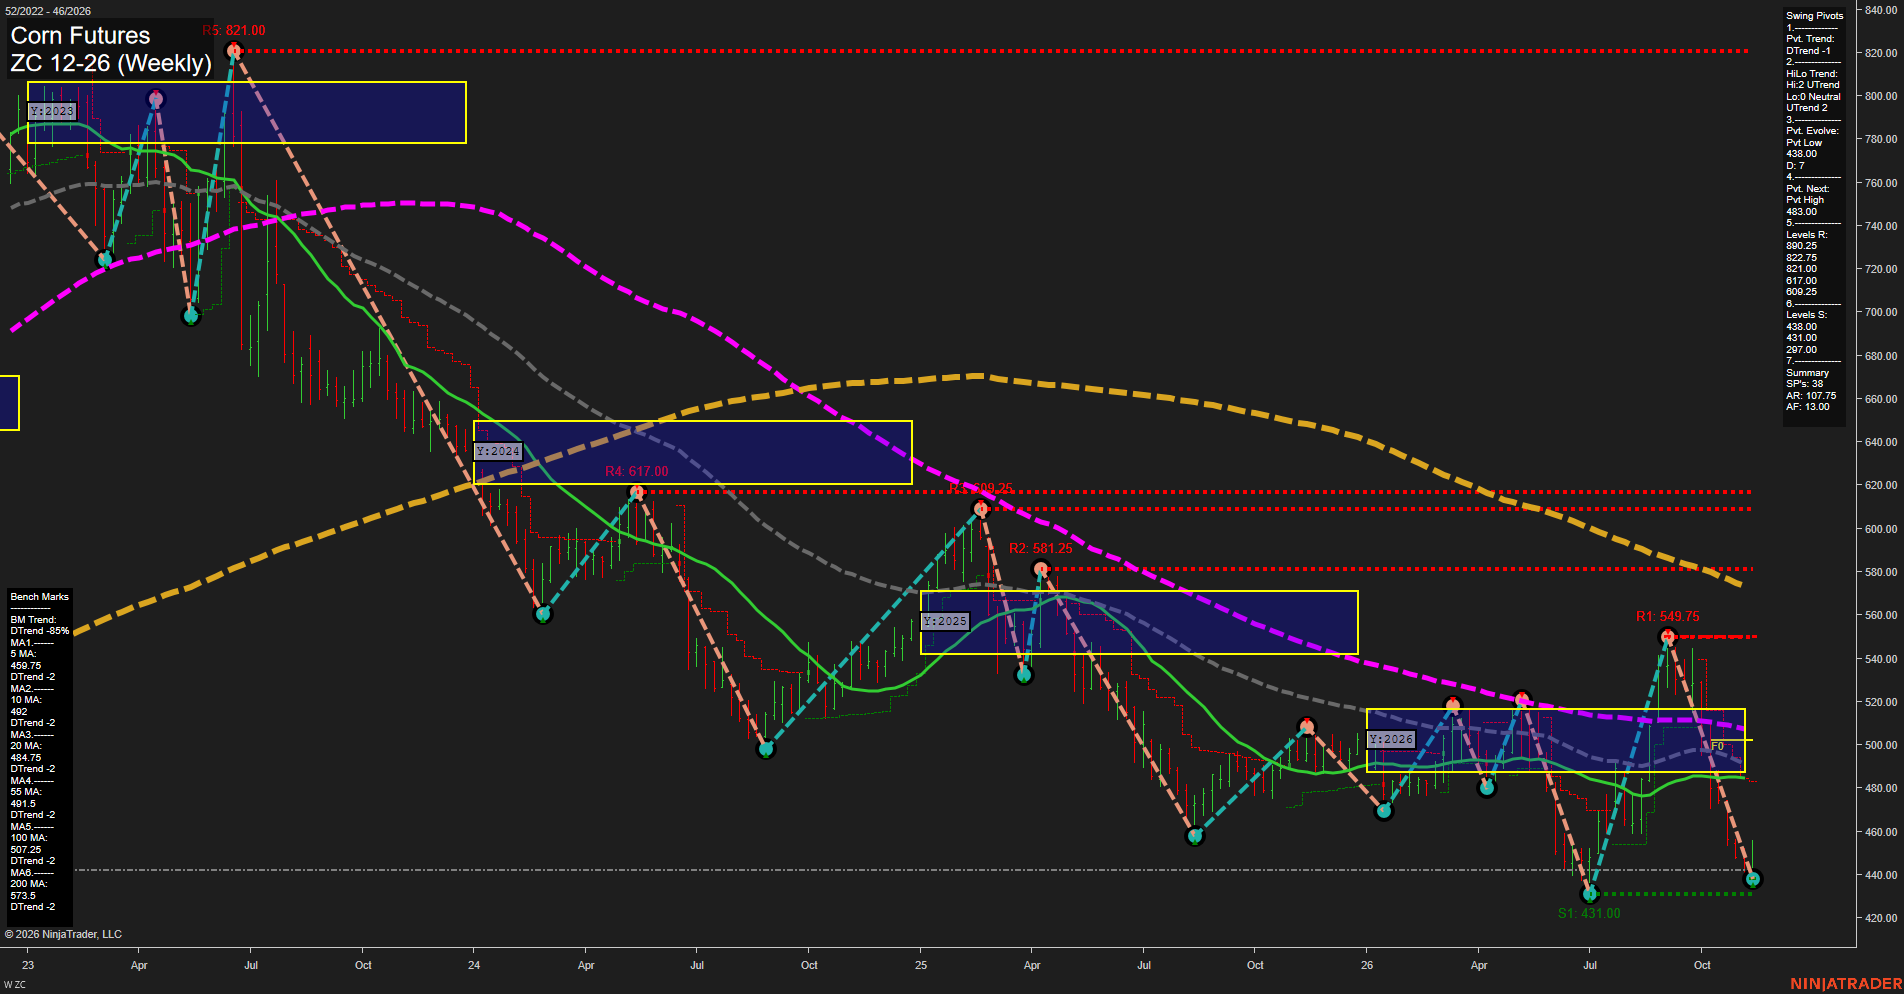
ZC Corn Futures Weekly Chart Analysis: 2026-Nov-12 15:17 CT
Price Action
- Last: Approximately 442; exact black price marker not legible,
- Bars: Large,
- Mom: Momentum fast.
WSFG Weekly
- Short-Term
- WSFG Current: 5%
- F0%/NTZ' Bias: Price Above,
- WSFG Trend: Up.
MSFG Month Nov
- Intermediate-Term
- MSFG Current: -9%
- F0%/NTZ' Bias: Price Below,
- MSFG Trend: Down.
YSFG Year 2026
- Long-Term
- YSFG Current: -41%
- F0%/NTZ' Bias: Price Below,
- YSFG Trend: Down.
Swing Pivots
- (Short-Term) 1. Pvt. Trend: DTrend,
- (Intermediate-Term) 2. HiLo Trend: UTrend,
- 3. Pvt. Evolve: Pvt low 438.00,
- 4. Pvt. Next: Pvt high 483.00,
- 5. Levels R: 890.25, 822.75, 821.00, 617.00, 609.25,
- 6. Levels S: 438.00, 431.00, 297.00.
Weekly Benchmarks
- (Short-Term) 5 Day: 459.75 Down Trend,
- (Short-Term) 10 Day: 492.00 Down Trend,
- (Intermediate-Term) 20 Day: 484.75 Down Trend,
- (Intermediate-Term) 55 Day: 491.50 Down Trend,
- (Long-Term) 100 Day: 507.25 Down Trend,
- (Long-Term) 200 Day: 573.50 Down Trend.
Recent Trade Signals
- 10 Nov 2026: Short ZC 12-26 @ 440.75 Signals.USAR-MSFG
- 09 Nov 2026: Short ZC 12-26 @ 439.25 Signals.USAR-WSFG
Overall Rating
- Short-Term: Bearish,
- Intermediate-Term: Bearish,
- Long-Term: Bearish.
Key Insights Summary
From a futures swing trader’s perspective, the dominant feature is the sharp reversal from 549.75 into the 438.00–431.00 support area. Large weekly ranges and the steep downswing indicate fast downside momentum, with price below all six declining benchmarks and beneath the yearly neutral zone. The evolving pivot low at 438.00 remains above the previous 431.00 low, explaining why the intermediate HiLo trend still reads UTrend despite substantial price deterioration. Weekly grid strength is a countertrend exception rather than broad confirmation of recovery; the monthly and yearly grids, current pivot trend, benchmark slopes, and supplied short signals favor a bearish interpretation. The nearby benchmark cluster around 484.75–492.00 represents overhead technical congestion. News catalysts and seasonal influences cannot be verified from this chart alone.
Chart Analysis ATS AI Generated: 2026-11-12 15:17 for Informational use only, not trading advice. Terms and Risk Disclosure Copyright © 2026. Algo Trading Systems LLC.