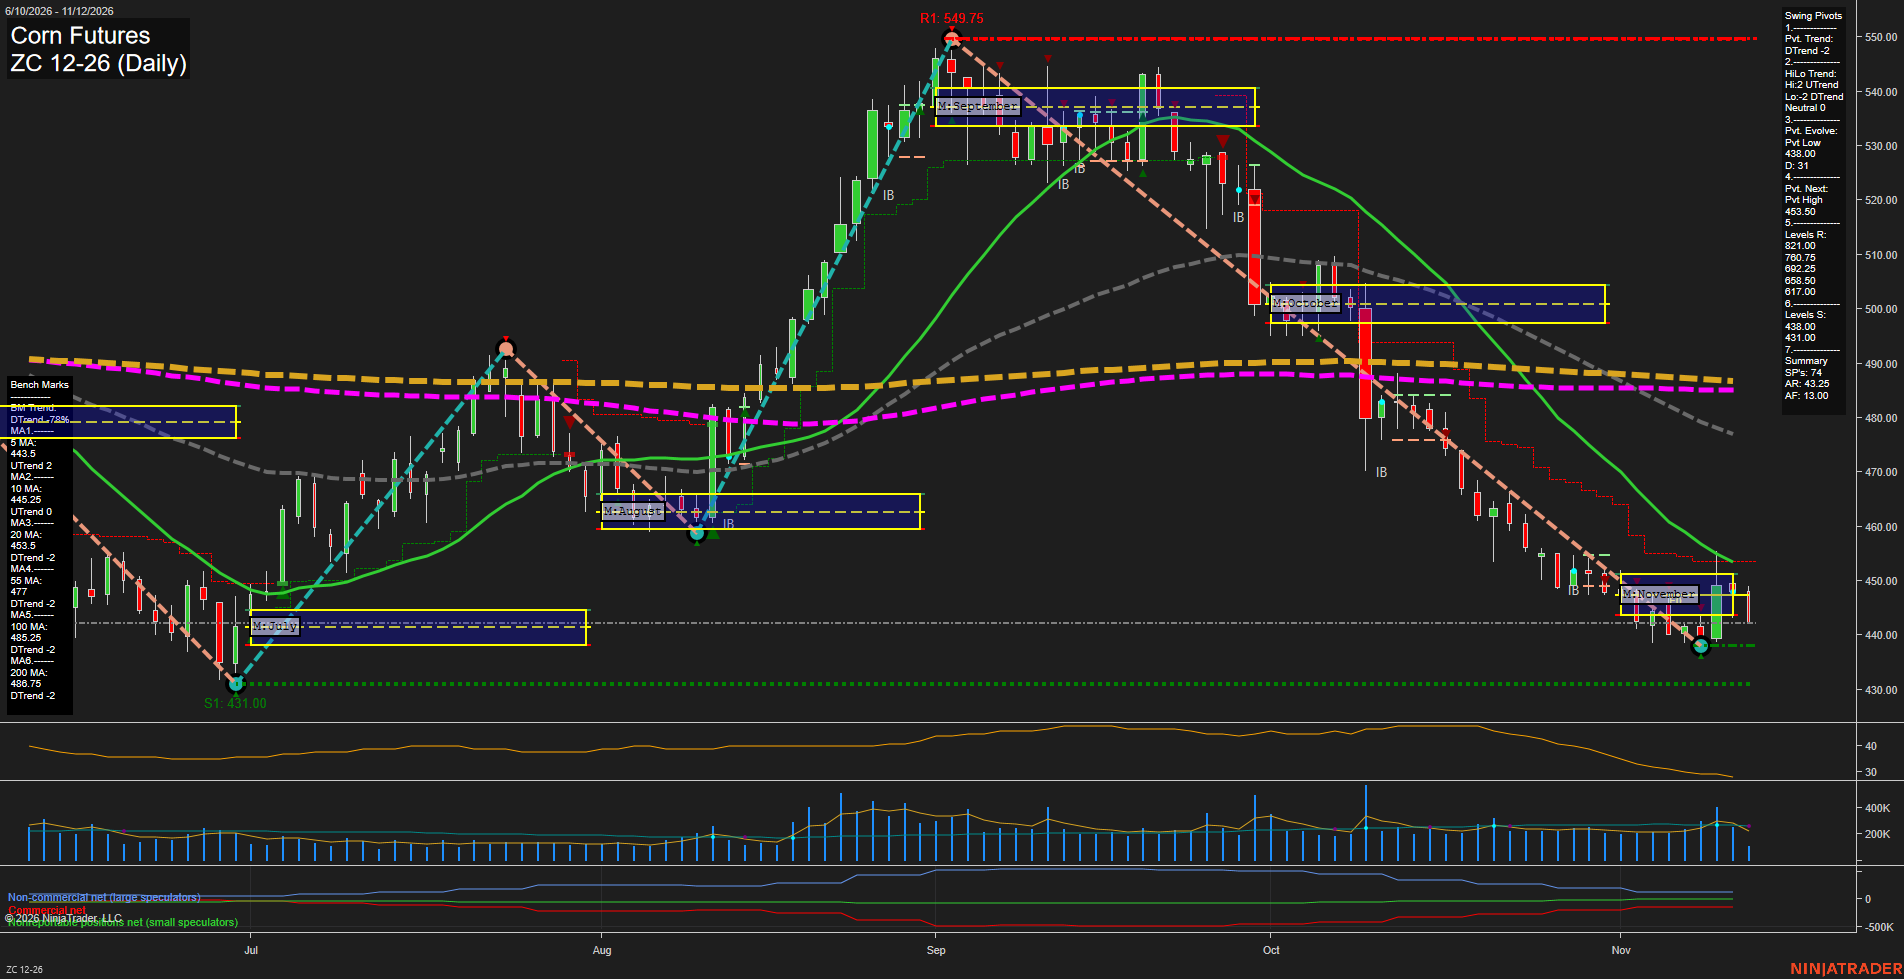
ZC Corn Futures Daily Chart Analysis: 2026-Nov-12 15:17 CT
Price Action
- Last: 442.25,
- Bars: Small,
- Mom: Momentum slow.
WSFG Weekly
- Short-Term
- WSFG Current: 5%
- F0%/NTZ' Bias: Price Above,
- WSFG Trend: Up.
MSFG Month Nov
- Intermediate-Term
- MSFG Current: -9%
- F0%/NTZ' Bias: Price Below,
- MSFG Trend: Down.
YSFG Year 2026
- Long-Term
- YSFG Current: -41%
- F0%/NTZ' Bias: Price Below,
- YSFG Trend: Down.
Swing Pivots
- (Short-Term) 1. Pvt. Trend: DTrend,
- (Intermediate-Term) 2. HiLo Trend: Neutral,
- 3. Pvt. Evolve: Pvt low 438.00,
- 4. Pvt. Next: Pvt high 453.50,
- 5. Levels R: 821.00, 760.75, 692.25, 658.50, 617.00,
- 6. Levels S: 438.00, 431.00.
Daily Benchmarks
- (Short-Term) 5 Day: 443.50 Up Trend,
- (Short-Term) 10 Day: 445.25 Up Trend,
- (Intermediate-Term) 20 Day: 453.50 Down Trend,
- (Intermediate-Term) 55 Day: 477.00 Down Trend,
- (Long-Term) 100 Day: 485.25 Down Trend,
- (Long-Term) 200 Day: 486.75 Down Trend.
Additional Metrics
Recent Trade Signals
- 10 Nov 2026: Short ZC 12-26 @ 440.75 Signals.USAR-MSFG
- 09 Nov 2026: Short ZC 12-26 @ 439.25 Signals.USAR-WSFG
Overall Rating
- Short-Term: Neutral,
- Intermediate-Term: Bearish,
- Long-Term: Bearish.
Key Insights Summary
The decline from September’s 549.75 high remains the dominant swing structure. A recent bounce from 438.00 has produced improving weekly conditions and upward short-term benchmark trends, but price remains below all six moving averages. This combination describes a countertrend recovery rather than an established bullish reversal. The latest pullback places price below the November neutral zone, with 438.00 and 431.00 defining the nearby support structure. The 453.50 next-pivot threshold coincides with the declining 20-day benchmark, creating an important overhead technical reference. The pivot summary reports a neutral intermediate HiLo trend, reflecting rising historical highs but falling lows; monthly conditions and both intermediate benchmarks nevertheless favor a bearish intermediate rating. Falling ATR and smaller recent bars indicate cooling volatility and slower momentum, not confirmation of a trend reversal. The supplied short signals remain aligned with the broader decline, despite the weekly rebound. Seasonal or news-driven explanations cannot be established from this chart alone.
Chart Analysis ATS AI Generated: 2026-11-12 15:17 for Informational use only, not trading advice. Terms and Risk Disclosure Copyright © 2026. Algo Trading Systems LLC.