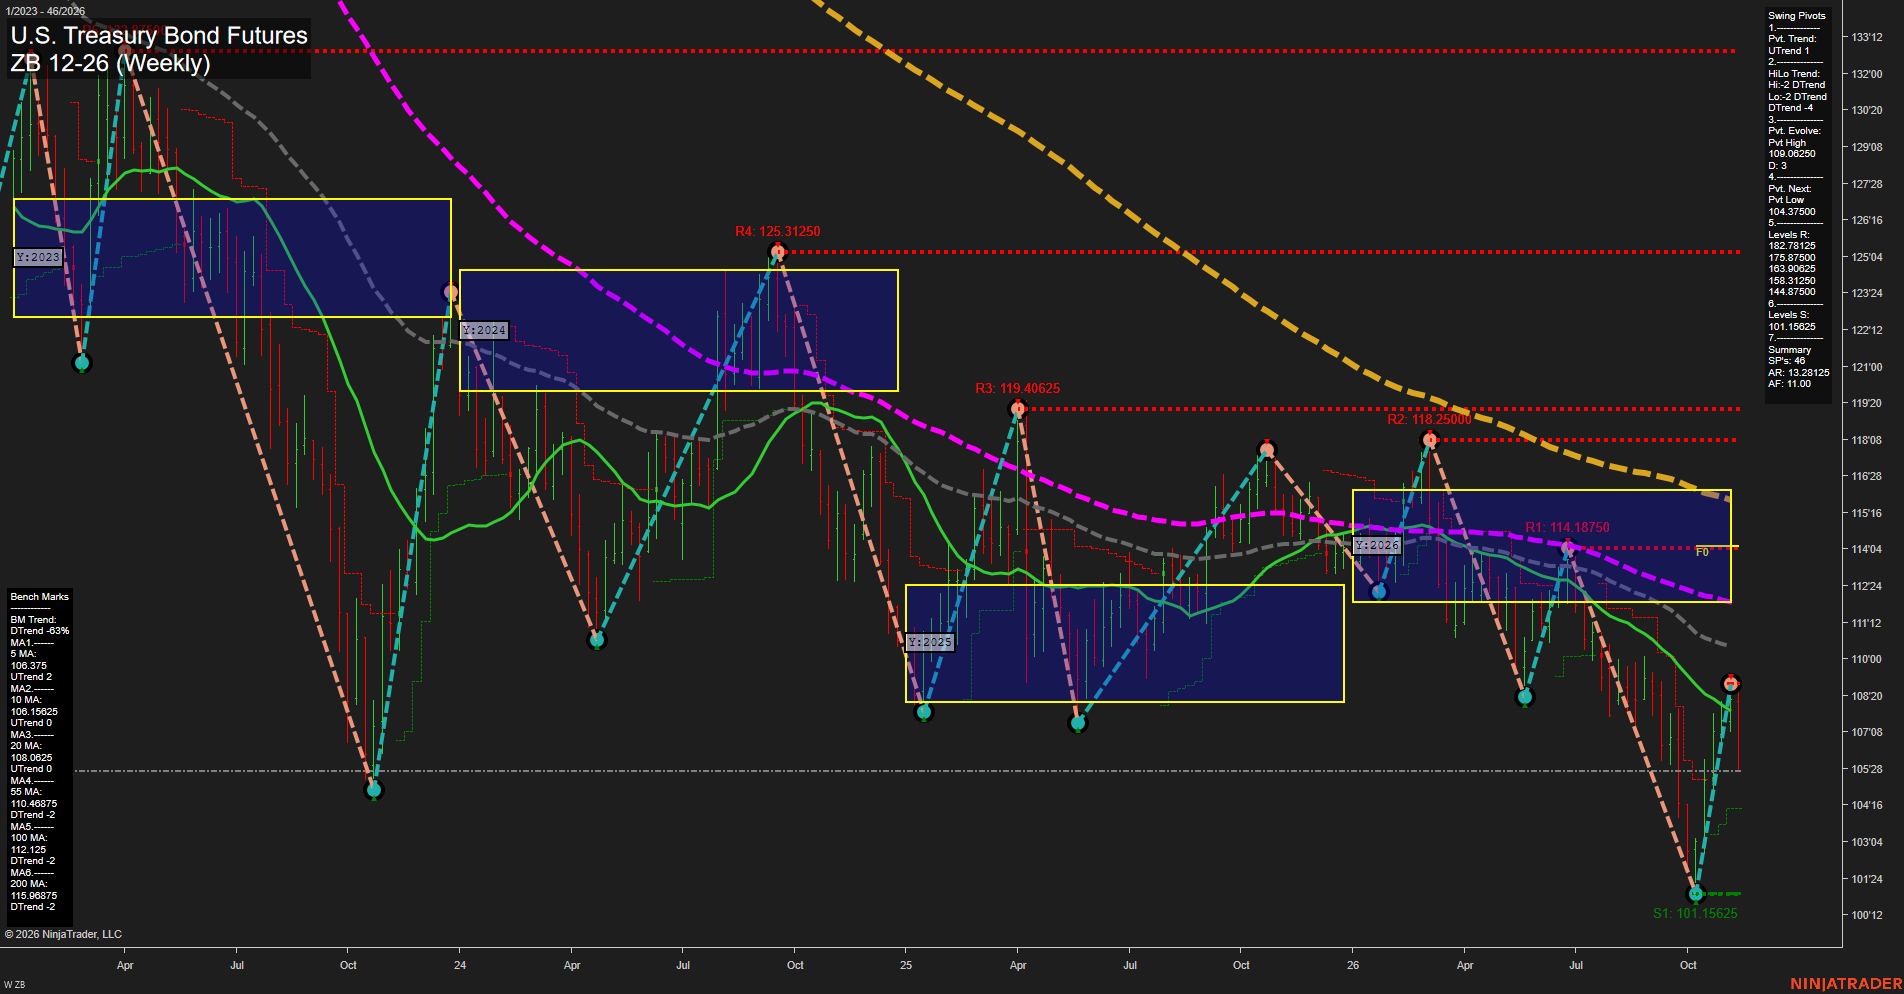
ZB U.S. Treasury Bond Futures Weekly Chart Analysis: 2026-Nov-12 15:17 CT
Price Action
- Last: Approximately 105.875 (105'28),
- Bars: Large,
- Mom: Fast, with renewed downside momentum after a sharp rebound.
WSFG Weekly
- Short-Term
- WSFG Current: -102%
- F0%/NTZ' Bias: Price Below,
- WSFG Trend: Down.
MSFG Month Nov
- Intermediate-Term
- MSFG Current: -38%
- F0%/NTZ' Bias: Price Below,
- MSFG Trend: Down.
YSFG Year 2026
- Long-Term
- YSFG Current: -40%
- F0%/NTZ' Bias: Price Below,
- YSFG Trend: Down.
Swing Pivots
- (Short-Term) 1. Pvt. Trend: UTrend,
- (Intermediate-Term) 2. HiLo Trend: DTrend,
- 3. Pvt. Evolve: Pvt high 109.06250,
- 4. Pvt. Next: Pvt low 104.37500,
- 5. Levels R: 182.78125, 175.87500, 163.90625, 158.31250, 144.87500,
- 6. Levels S: 101.15625.
Weekly Benchmarks
- (Short-Term) 5 Day: 106.375 Up Trend,
- (Short-Term) 10 Day: 106.15625 Up Trend,
- (Intermediate-Term) 20 Day: 108.0625 Up Trend,
- (Intermediate-Term) 55 Day: 110.46875 Down Trend,
- (Long-Term) 100 Day: 112.125 Down Trend,
- (Long-Term) 200 Day: 115.96875 Down Trend.
Overall Rating
- Short-Term: Neutral,
- Intermediate-Term: Bearish,
- Long-Term: Bearish.
Key Insights Summary
From a futures swing trader's perspective, the rebound from 101.15625 to an evolving high of 109.06250 remains a countertrend recovery within a broader declining structure. The short-term pivot uptrend and rising shorter benchmarks conflict with the downward session-grid readings, leaving the short-term picture mixed. Price is approximately 105.875, inferred from the horizontal price line because the last-price marker is not clearly visible, and sits below all six benchmarks. The next opposite pivot threshold is 104.37500; the major visible support remains 101.15625. The resistance values above reproduce the Swing Pivots summary, while nearer resistance lines actually plotted are 114.18750, 118.25000, 119.40625 and 125.31250. Falling longer benchmarks, lower swing highs and price below the yearly NTZ support bearish intermediate- and long-term ratings. Recent trade-signal readings are not visible, and the chart alone does not establish news or seasonal drivers.
Chart Analysis ATS AI Generated: 2026-11-12 15:17 for Informational use only, not trading advice. Terms and Risk Disclosure Copyright © 2026. Algo Trading Systems LLC.