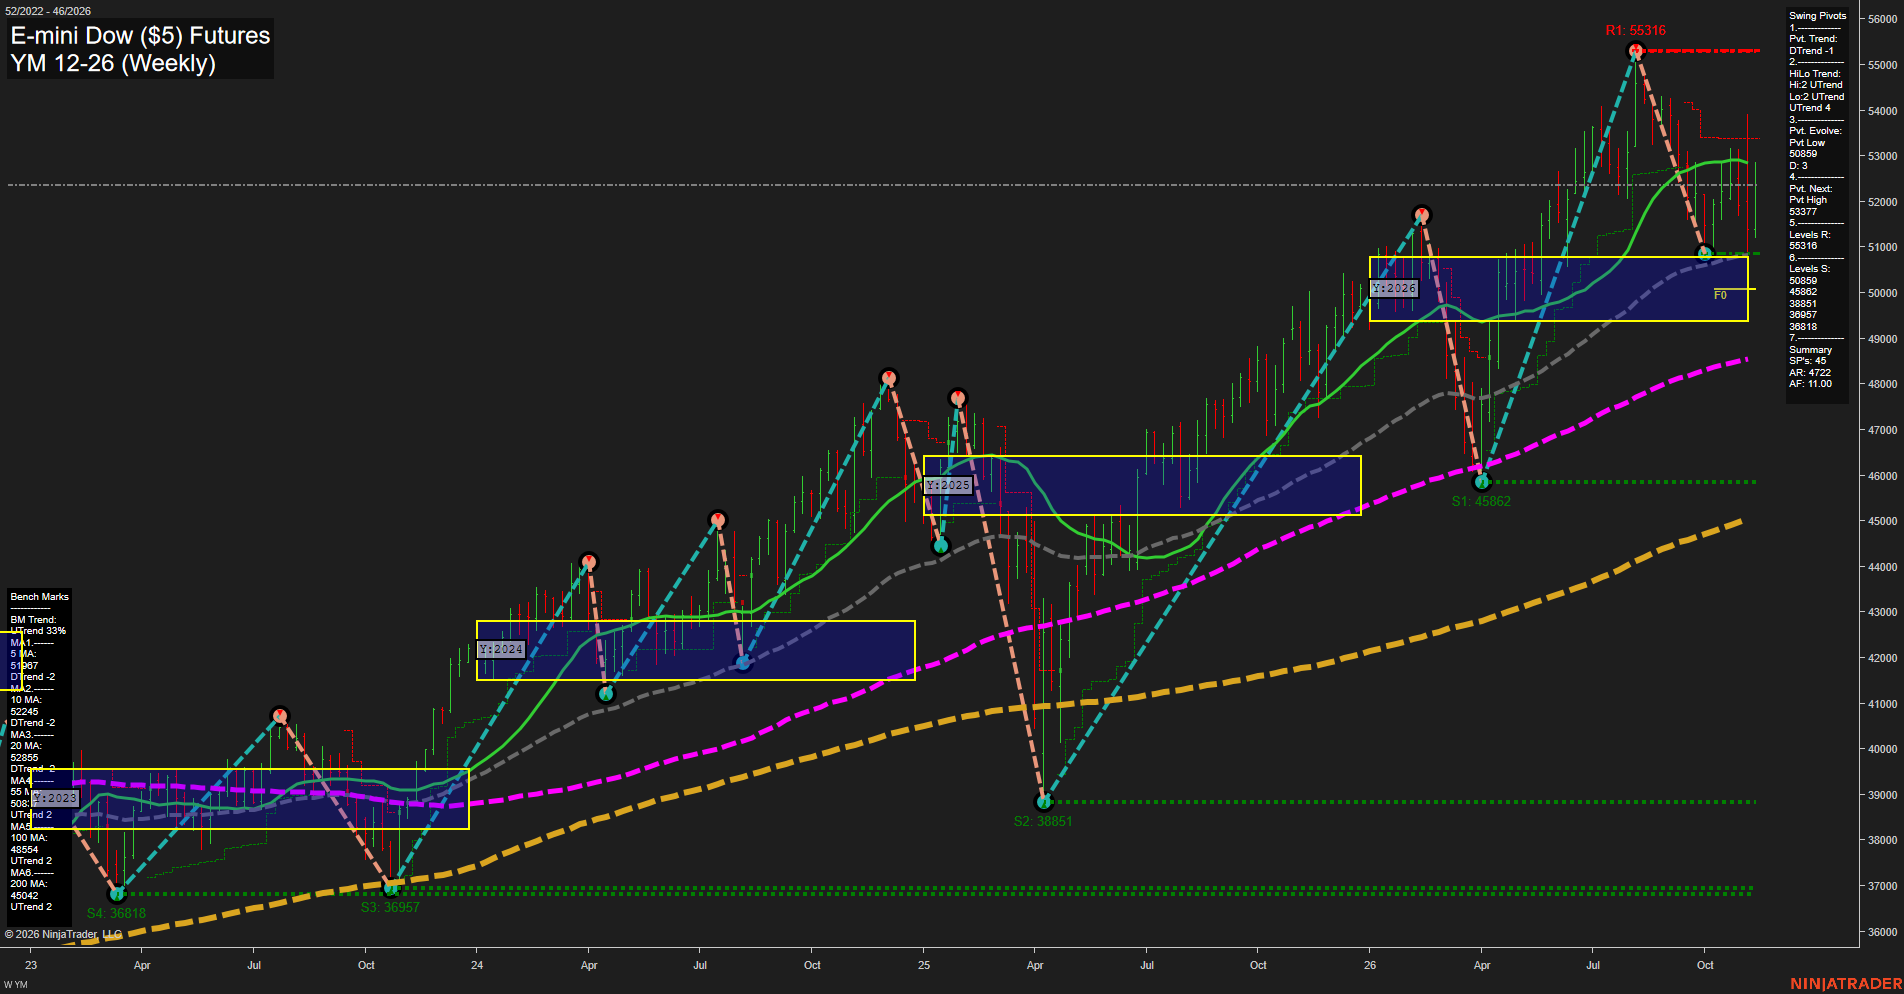
YM E-mini Dow ($5) Futures Weekly Chart Analysis: 2026-Nov-12 15:16 CT
Price Action
- Last: Approximately 52,400; exact black price marker not legible,
- Bars: Large,
- Mom: Momentum average.
WSFG Weekly
- Short-Term
- WSFG Current: 59%
- F0%/NTZ' Bias: Price Above,
- WSFG Trend: Up.
MSFG Month Nov
- Intermediate-Term
- MSFG Current: 17%
- F0%/NTZ' Bias: Price Above,
- MSFG Trend: Up.
YSFG Year 2026
- Long-Term
- YSFG Current: 33%
- F0%/NTZ' Bias: Price Above,
- YSFG Trend: Up.
Swing Pivots
- (Short-Term) 1. Pvt. Trend: DTrend,
- (Intermediate-Term) 2. HiLo Trend: UTrend,
- 3. Pvt. Evolve: Pvt low 50,859,
- 4. Pvt. Next: Pvt high 53,377,
- 5. Levels R: 55,316,
- 6. Levels S: 50,859, 45,862, 38,851, 36,957, 36,818.
Weekly Benchmarks
- (Short-Term) 5 Day: 51,967 Down Trend,
- (Short-Term) 10 Day: 52,245 Down Trend,
- (Intermediate-Term) 20 Day: 52,855 Down Trend,
- (Intermediate-Term) 55 Day: Approximately 50,800 Up Trend,
- (Long-Term) 100 Day: 48,554 Up Trend,
- (Long-Term) 200 Day: 45,042 Up Trend.
Recent Trade Signals
- 09 Nov 2026: Long YM 12-26 @ 52363 Signals.USAR-MSFG
- 09 Nov 2026: Long YM 12-26 @ 51732 Signals.USAR-WSFG
Overall Rating
- Short-Term: Bullish,
- Intermediate-Term: Bullish,
- Long-Term: Bullish.
Key Insights Summary
The weekly structure shows a corrective downswing within a broader uptrend, followed by a rebound from the evolving 50,859 pivot low. Large, overlapping bars indicate volatile consolidation rather than a clean momentum breakout. Short-term conditions lean bullish on the supplied weekly grid and recent long signals, but remain mixed because the pivot trend and 5-, 10-, and 20-period benchmark slopes are down. Price is approximately above the two fastest benchmarks but below the 52,855 intermediate benchmark. The 53,377 next-pivot threshold separates the current rebound from an opposite-pivot confirmation; 55,316 remains overhead swing resistance. Intermediate higher-high/higher-low structure and rising longer benchmarks support the broader bullish assessment. The 50,859 pivot sits near the rising 55-period benchmark and the upper yearly NTZ boundary, forming a notable support cluster. The chart alone does not establish a news catalyst or seasonal explanation, and the listed trade signals are supplied context rather than independently visible chart annotations.
Chart Analysis ATS AI Generated: 2026-11-12 15:17 for Informational use only, not trading advice. Terms and Risk Disclosure Copyright © 2026. Algo Trading Systems LLC.