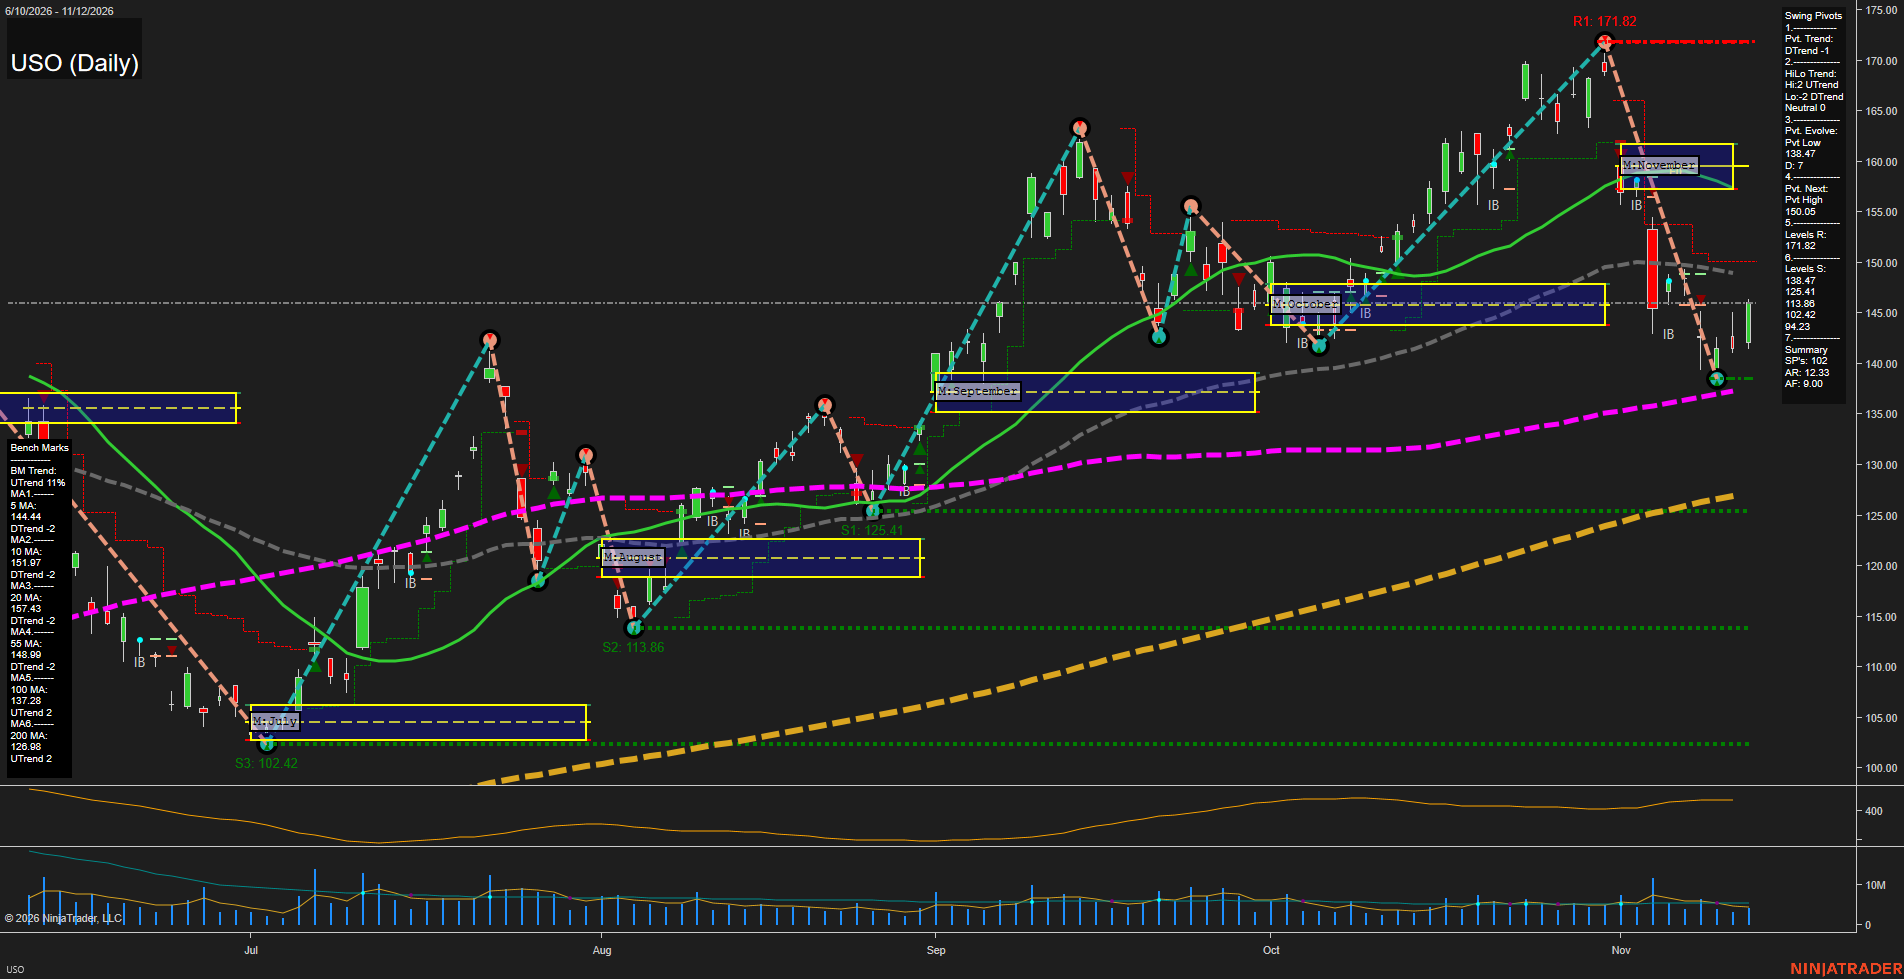
From a futures swing trader’s perspective, USO shows a sharp corrective downswing within a still-rising long-term structure. The decline from 171.82 to 138.47 was approximately 19.4%; the latest rebound has recovered the 5-day benchmark but remains below the declining 10-, 20- and 55-day averages. The 148.99 benchmark and 150.05 opposite-pivot threshold define the nearest overhead technical cluster. Support at 138.47 sits just above the rising 100-day average at 137.28. The pivot summary explicitly reports a neutral HiLo trend, reflecting conflicting high- and low-pivot trends. Although the grid fields above are neutral placeholders, price visibly sits below November’s monthly neutral zone, approximately 157–162, reinforcing intermediate-term weakness. The rebound remains a countertrend move rather than a confirmed upside pivot reversal. Weekly and yearly grids and named strategy signals are not visible; news and seasonal explanations cannot be established from this chart. The last price is estimated because its black marker is not legible; ATR and VOLMA reproduce the supplied template values rather than independently verified panel readings. USO is an oil-futures-linked ETF, so its price levels are not crude futures contract levels.