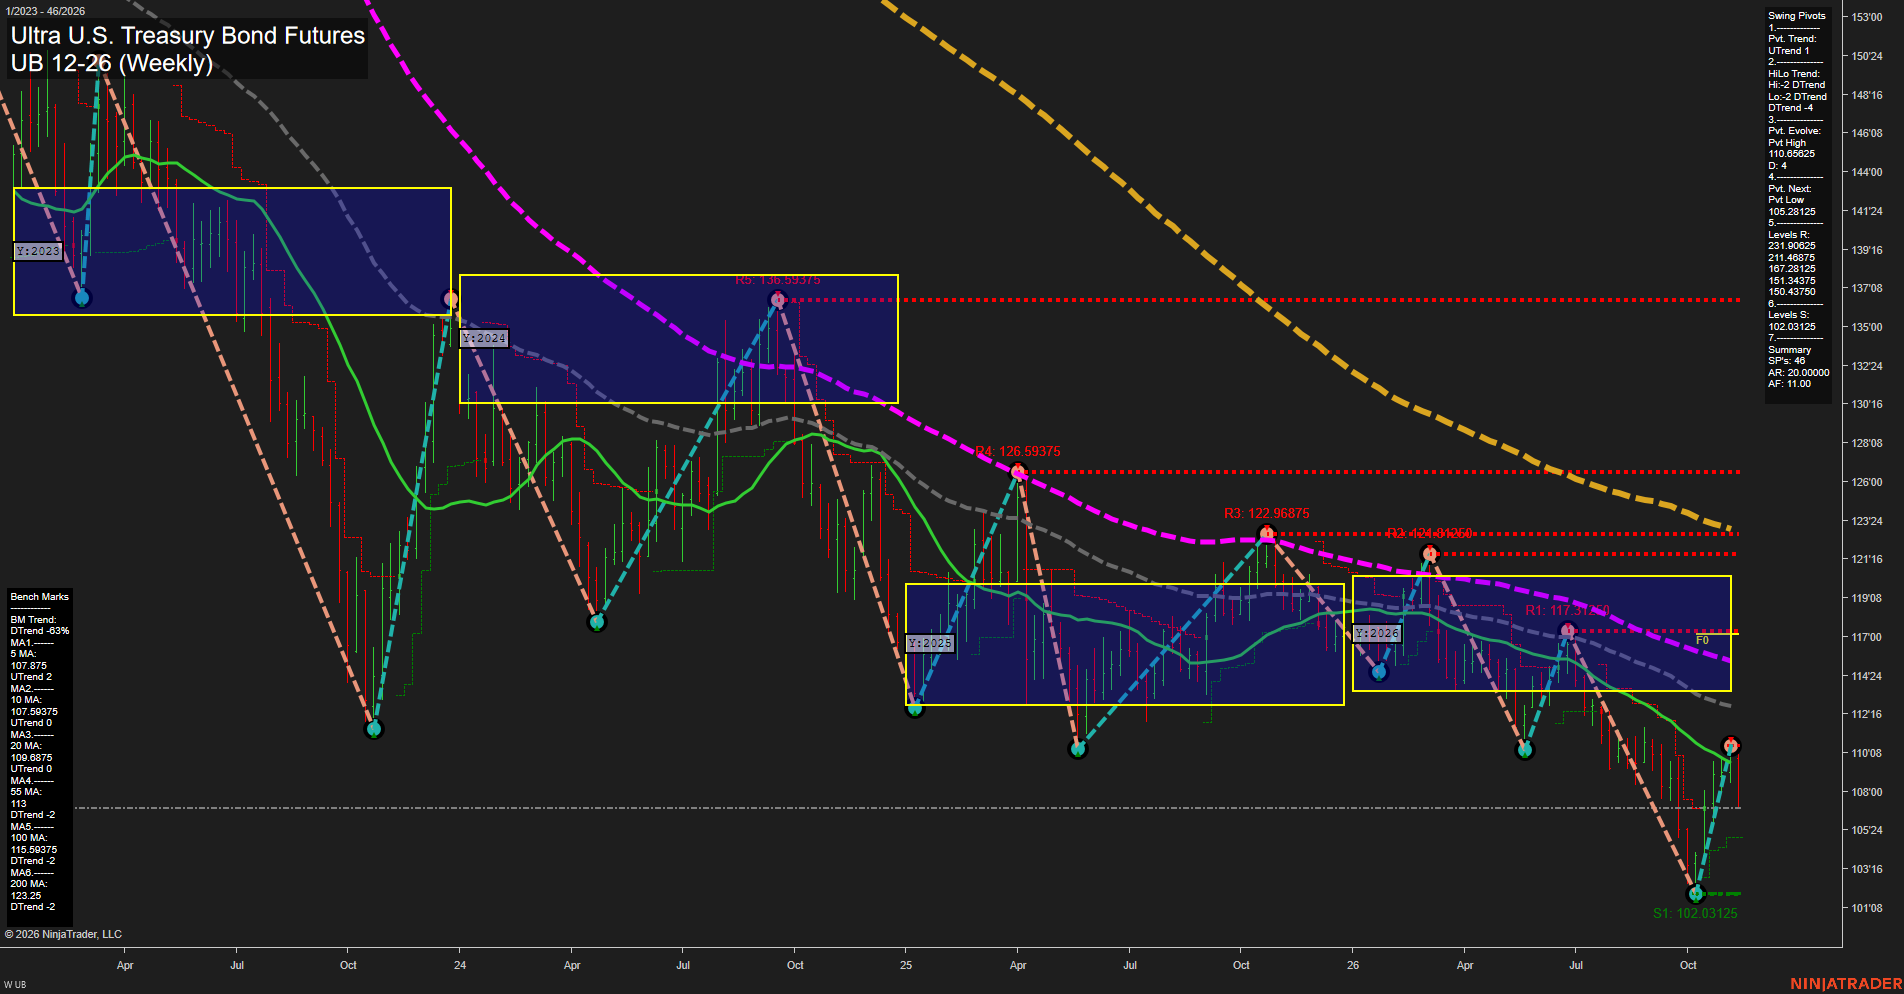
UB Ultra U.S. Treasury Bond Futures Weekly Chart Analysis: 2026-Nov-12 15:15 CT
Price Action
- Last: Approximately 107.00; exact black price marker not visible,
- Bars: Large,
- Mom: Momentum fast.
WSFG Weekly
- Short-Term
- WSFG Current: -97%
- F0%/NTZ' Bias: Price Below,
- WSFG Trend: Down.
MSFG Month Nov
- Intermediate-Term
- MSFG Current: -37%
- F0%/NTZ' Bias: Price Below,
- MSFG Trend: Down.
YSFG Year 2026
- Long-Term
- YSFG Current: -30%
- F0%/NTZ' Bias: Price Below,
- YSFG Trend: Down.
Swing Pivots
- (Short-Term) 1. Pvt. Trend: UTrend,
- (Intermediate-Term) 2. HiLo Trend: DTrend,
- 3. Pvt. Evolve: Pvt high 110.65625,
- 4. Pvt. Next: Pvt low 105.28125,
- 5. Levels R: 231.90625, 211.46875, 167.28125, 151.34375, 150.43750,
- 6. Levels S: 102.03125.
Weekly Benchmarks
- (Short-Term) 5 Day: 107.875 Up Trend,
- (Short-Term) 10 Day: 107.59375 Up Trend,
- (Intermediate-Term) 20 Day: 109.6875 Up Trend,
- (Intermediate-Term) 55 Day: 113 Down Trend,
- (Long-Term) 100 Day: 115.59375 Down Trend,
- (Long-Term) 200 Day: 123.25 Down Trend.
Recent Trade Signals
- 12 Nov 2026: Short UB 12-26 @ 107.25 Signals.USAR.TR720
- 12 Nov 2026: Short UB 12-26 @ 108.5 Signals.USAR-MSFG
- 10 Nov 2026: Short UB 12-26 @ 108.6875 Signals.USAR.TR120
- 04 Nov 2026: Long UB 12-26 @ 109.59375 Signals.USAR-WSFG
Overall Rating
- Short-Term: Bearish,
- Intermediate-Term: Bearish,
- Long-Term: Bearish.
Key Insights Summary
The weekly structure remains a broad downtrend, with the rebound from 102.03125 to an evolving pivot high at 110.65625 resembling a countertrend recovery rather than an established reversal. The latest large bearish bar has retraced much of that rebound, returning price below all six benchmarks despite upward readings in the three shortest averages. The short-term pivot uptrend therefore conflicts with renewed downside price momentum, while the intermediate pivot structure, all three session grids, and falling longer-term benchmarks reinforce the bearish backdrop. Recent short signals across multiple horizons outweigh the earlier weekly long signal. The next opposite-pivot threshold is 105.28125, with 102.03125 the listed swing support. Resistance values above are transcribed from the summary as requested, but differ materially from the visible chart labels, whose nearest overhead swing resistance is 117.31250. The image provides no news or seasonal evidence to establish a fundamental catalyst.
Chart Analysis ATS AI Generated: 2026-11-12 15:15 for Informational use only, not trading advice. Terms and Risk Disclosure Copyright © 2026. Algo Trading Systems LLC.