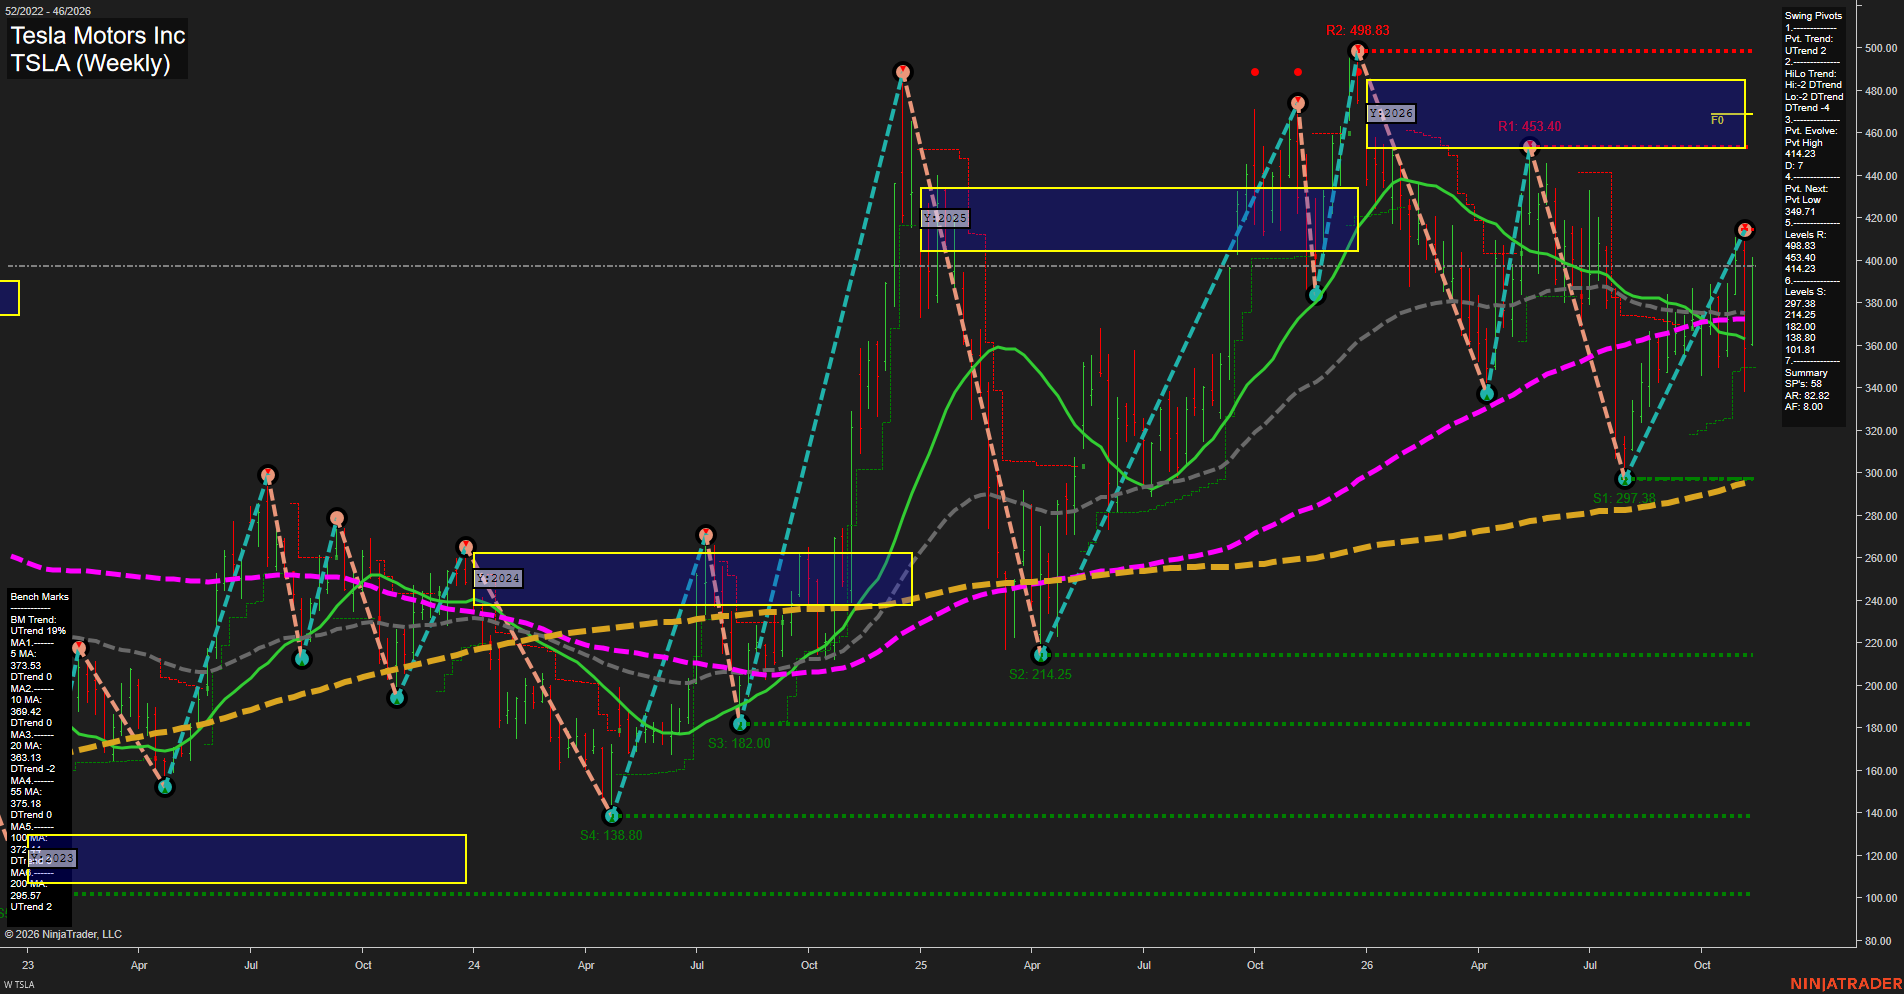
TSLA Tesla Motors Inc Weekly Chart Analysis: 2026-Nov-12 15:15 CT
Price Action
- Last: Not legible; horizontal price guide approximately 397,
- Bars: Large,
- Mom: Average; recovery momentum within a volatile weekly range.
WSFG Weekly
- Short-Term
- WSFG Current: NA%
- F0%/NTZ' Bias: Price Neutral,
- WSFG Trend: Neutral.
MSFG Month Nov
- Intermediate-Term
- MSFG Current: NA%
- F0%/NTZ' Bias: Price Neutral,
- MSFG Trend: Neutral.
YSFG Year 2026
- Long-Term
- YSFG Current: NA%
- F0%/NTZ' Bias: Price below NTZ,
- YSFG Trend: Bearish.
Swing Pivots
- (Short-Term) 1. Pvt. Trend: UTrend,
- (Intermediate-Term) 2. HiLo Trend: DTrend,
- 3. Pvt. Evolve: Pvt high 414.23,
- 4. Pvt. Next: Pvt low 349.71,
- 5. Levels R: 498.83, 453.40, 414.23,
- 6. Levels S: 297.38, 214.25, 182.00, 138.80, 101.81.
Weekly Benchmarks
- (Short-Term) 5 Day: 373.53 Down Trend,
- (Short-Term) 10 Day: 369.42 Down Trend,
- (Intermediate-Term) 20 Day: 363.13 Down Trend,
- (Intermediate-Term) 55 Day: 375.18 Down Trend,
- (Long-Term) 100 Day: Approximately 372.4 Down Trend,
- (Long-Term) 200 Day: 295.57 Up Trend.
Overall Rating
- Short-Term: Neutral,
- Intermediate-Term: Bearish,
- Long-Term: Neutral.
Key Insights Summary
From a futures swing trader’s perspective, the defining feature is a short-term recovery inside an intermediate-term downtrend, rather than a confirmed broad trend reversal. The rebound from 297.38 has developed an evolving pivot high at 414.23, below earlier resistance at 453.40 and 498.83. Price is above the clustered weekly benchmarks around 363–375, but their predominantly declining trends show that moving-average confirmation remains weak. The rising 200-period benchmark near 295.57 preserves a constructive major-trend element, while price below the 2026 yearly neutral zone signals overhead resistance. Wide weekly ranges and alternating sharp swings characterize a volatile, two-sided market. Weekly and monthly grids, recent trade-signal readings, and news catalysts are not supplied; their neutral entries represent unavailable confirmation rather than observed neutral signals. This is a TSLA equity chart, not a futures contract chart.
Chart Analysis ATS AI Generated: 2026-11-12 15:15 for Informational use only, not trading advice. Terms and Risk Disclosure Copyright © 2026. Algo Trading Systems LLC.