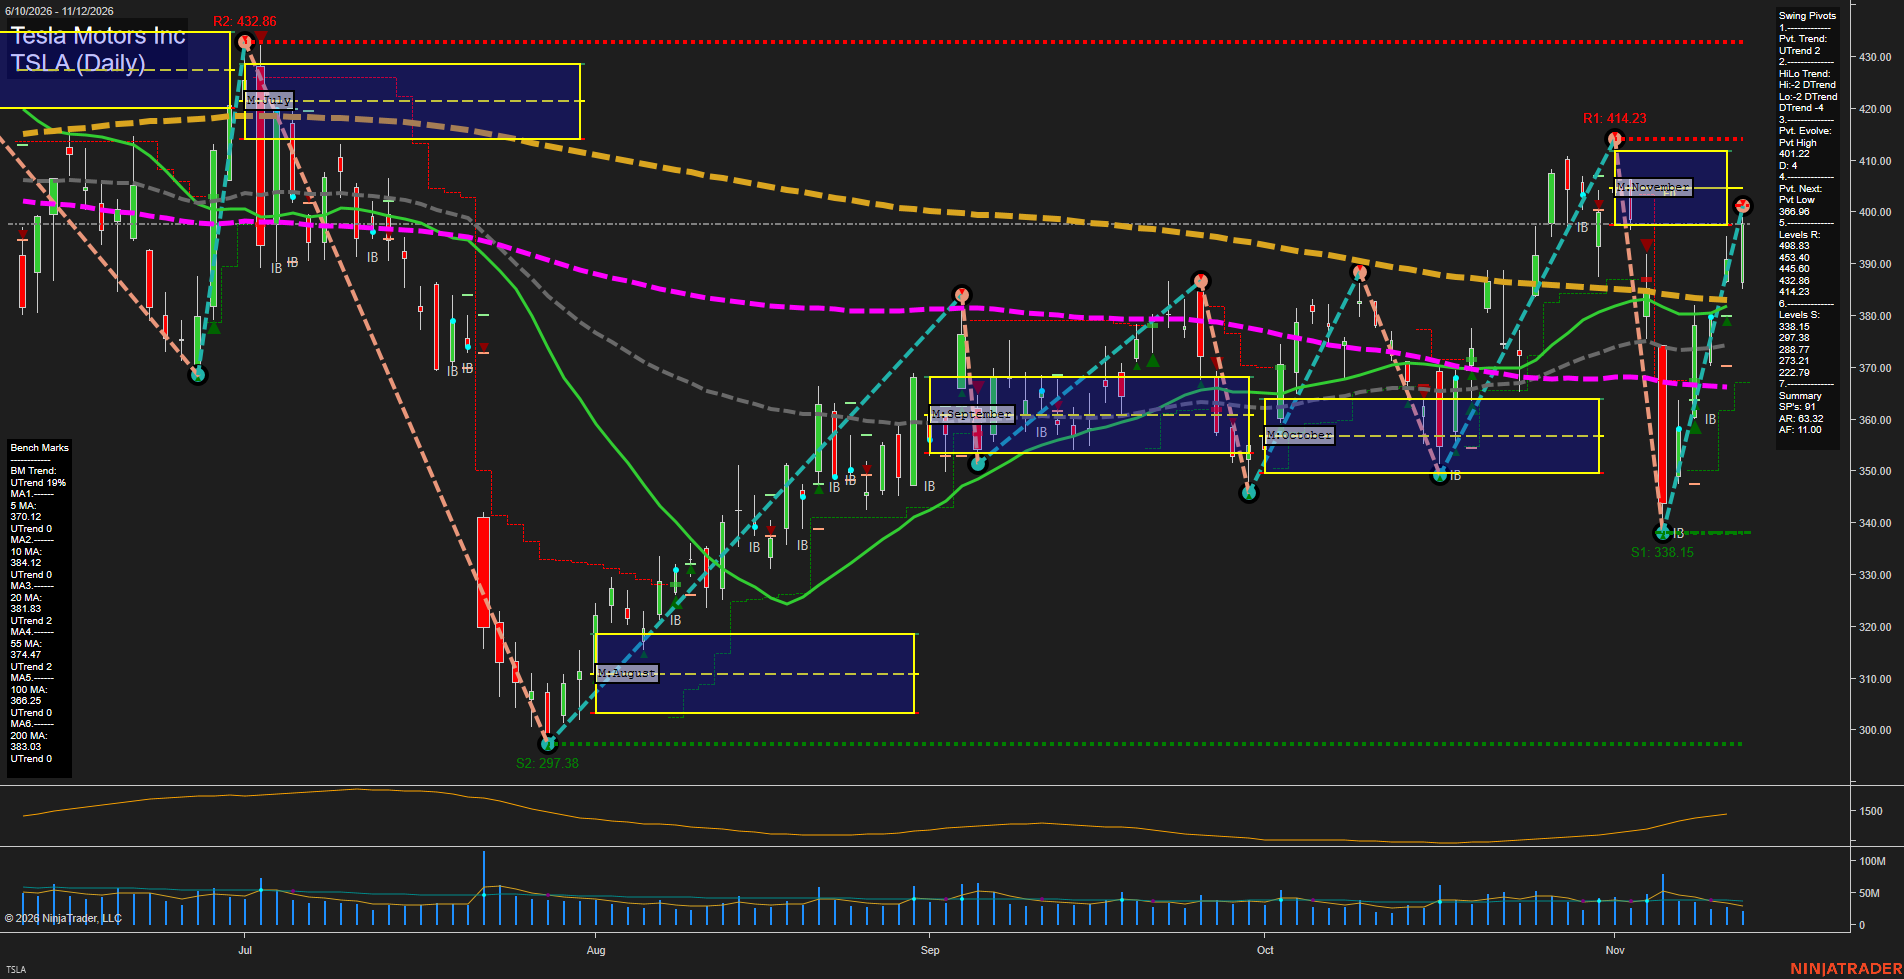
TSLA Tesla Motors Inc Daily Chart Analysis: 2026-Nov-12 15:15 CT
Price Action
- Last: Approximately 397.70,
- Bars: Large,
- Mom: Momentum fast.
WSFG Weekly
- Short-Term
- WSFG Current: NA%
- F0%/NTZ' Bias: Price Neutral,
- WSFG Trend: Neutral.
MSFG Month Nov
- Intermediate-Term
- MSFG Current: NA%
- F0%/NTZ' Bias: Price Neutral,
- MSFG Trend: Neutral.
YSFG Year 2026
- Long-Term
- YSFG Current: NA%
- F0%/NTZ' Bias: Price Neutral,
- YSFG Trend: Neutral.
Swing Pivots
- (Short-Term) 1. Pvt. Trend: UTrend,
- (Intermediate-Term) 2. HiLo Trend: DTrend,
- 3. Pvt. Evolve: Pvt high 401.22,
- 4. Pvt. Next: Pvt low 366.96,
- 5. Levels R: 498.83, 453.40, 445.60, 432.86, 414.23,
- 6. Levels S: 338.15, 297.38, 288.77, 273.21, 222.79.
Daily Benchmarks
- (Short-Term) 5 Day: 370.12 Up Trend,
- (Short-Term) 10 Day: 384.12 Up Trend,
- (Intermediate-Term) 20 Day: 381.83 Up Trend,
- (Intermediate-Term) 55 Day: 374.47 Up Trend,
- (Long-Term) 100 Day: 366.25 Up Trend,
- (Long-Term) 200 Day: 383.03 Up Trend.
Additional Metrics
- ATR: 2032,
- VOLMA: 72571229.
Overall Rating
- Short-Term: Bullish,
- Intermediate-Term: Bullish,
- Long-Term: Bullish.
Key Insights Summary
From a futures swing trader’s perspective, the dominant feature is a fast V-shaped recovery from 338.15 following rejection at 414.23. Price has reclaimed all six benchmark averages, supporting bullish directional ratings, although the intermediate pivot structure remains a downtrend with lower highs and lower lows. The developing 401.22 pivot high remains below 414.23 resistance, so the rebound has not yet established a broader pivot-trend reversal. November’s neutral-zone lower boundary is near current price, with its center and upper boundary still overhead. Rising ATR indicates expanding daily ranges, while recent rebound volume appears lighter than the selloff spike. The result is strong recovery momentum within a volatile, structurally unresolved trading range. Weekly and yearly grids, named trade-signal readings, and news catalysts are not visible; seasonality and futures-specific positioning cannot be established from this equity chart.
Chart Analysis ATS AI Generated: 2026-11-12 15:15 for Informational use only, not trading advice. Terms and Risk Disclosure Copyright © 2026. Algo Trading Systems LLC.