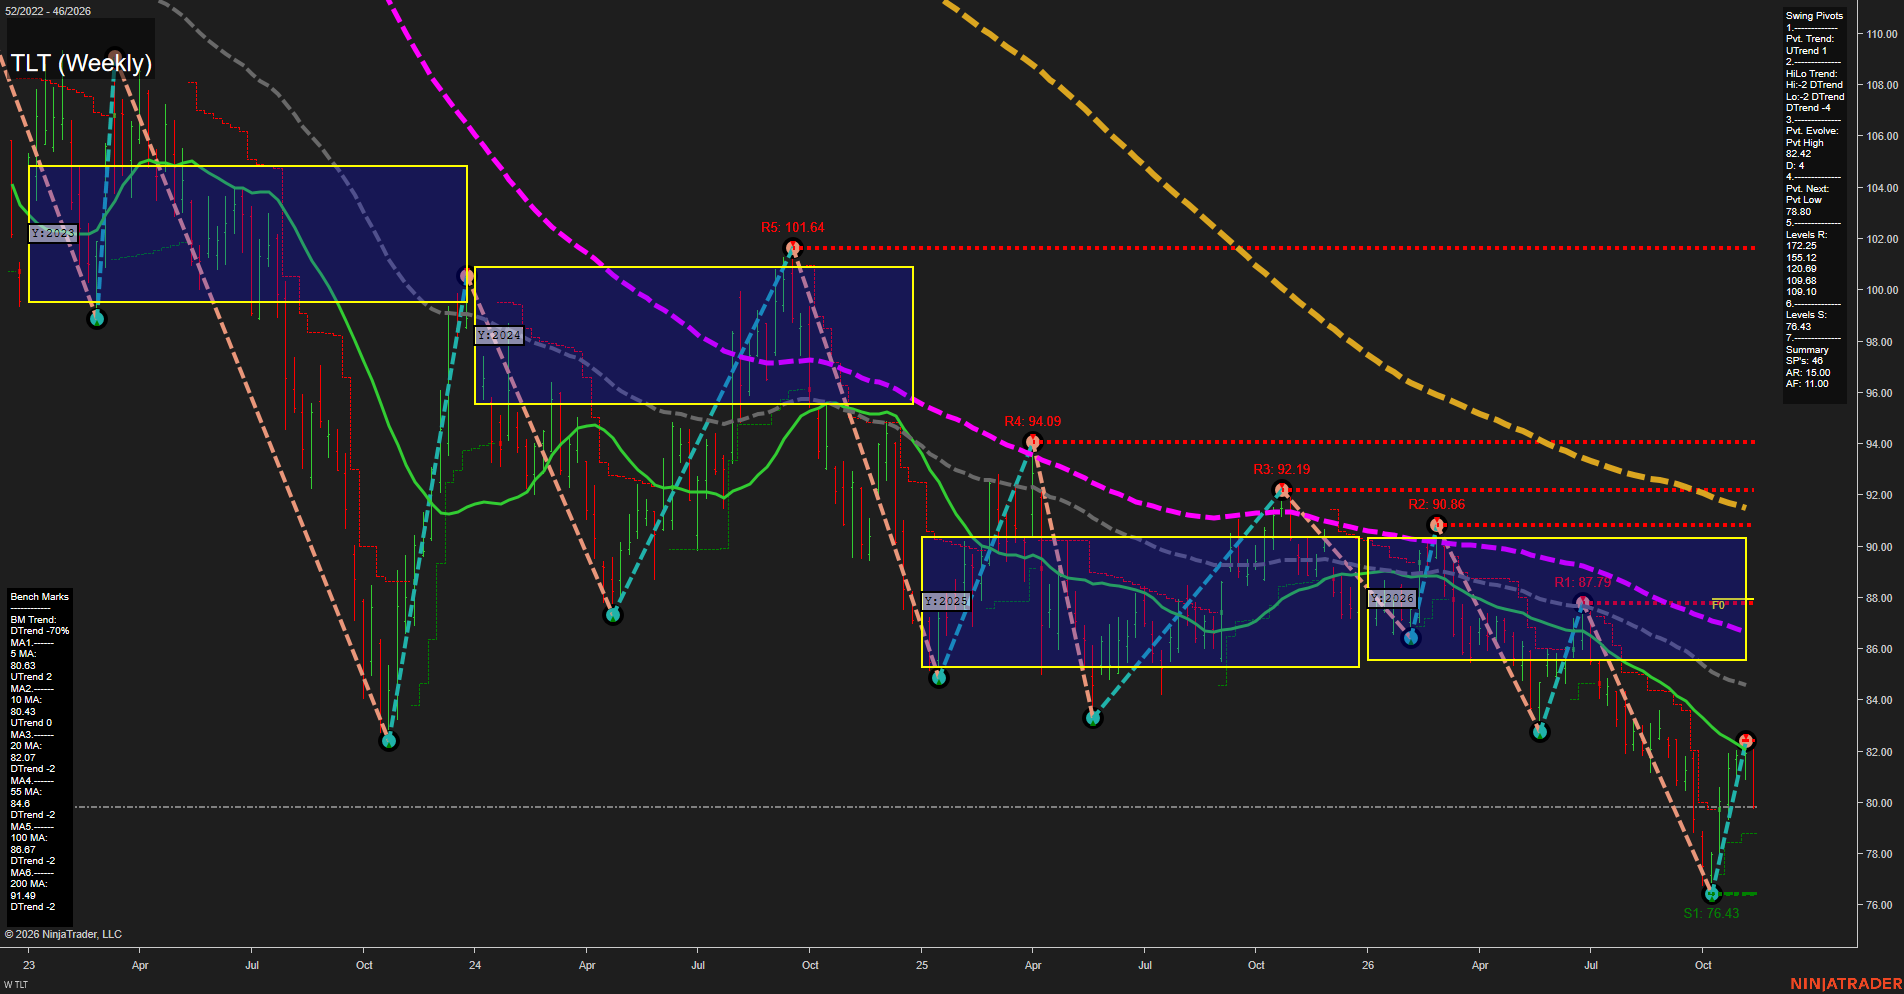
TLT TLT Weekly Chart Analysis: 2026-Nov-12 15:14 CT
Price Action
- Last: Approximately 79.90,
- Bars: Medium,
- Mom: Average; the recent rebound is losing momentum.
WSFG Weekly
- Short-Term
- WSFG Current: NA%
- F0%/NTZ' Bias: Price Neutral,
- WSFG Trend: Neutral.
MSFG Month Nov
- Intermediate-Term
- MSFG Current: NA%
- F0%/NTZ' Bias: Price Neutral,
- MSFG Trend: Neutral.
YSFG Year 2026
- Long-Term
- YSFG Current: NA%
- F0%/NTZ' Bias: Price below F0% and NTZ,
- YSFG Trend: Bearish.
Swing Pivots
- (Short-Term) 1. Pvt. Trend: UTrend,
- (Intermediate-Term) 2. HiLo Trend: DTrend,
- 3. Pvt. Evolve: Pvt high 82.42,
- 4. Pvt. Next: Pvt low 78.80,
- 5. Levels R: 172.25, 155.12, 120.69, 109.68, 109.10,
- 6. Levels S: 76.43.
Weekly Benchmarks
- (Short-Term) 5 Day: 80.63 Up Trend,
- (Short-Term) 10 Day: 80.43 Up Trend,
- (Intermediate-Term) 20 Day: 82.07 Down Trend,
- (Intermediate-Term) 55 Day: 84.60 Down Trend,
- (Long-Term) 100 Day: 86.67 Down Trend,
- (Long-Term) 200 Day: 91.40 Down Trend.
Overall Rating
- Short-Term: Bullish,
- Intermediate-Term: Bearish,
- Long-Term: Bearish.
Key Insights Summary
From a futures swing trader’s perspective, TLT shows a short-term countertrend rebound within an established intermediate- and long-term decline. The recovery from 76.43 to an evolving 82.42 pivot high has turned the short pivot trend upward, but price has slipped back below both rising short-term benchmarks. This makes the bullish short-term rating fragile rather than evidence of a broader reversal. The 78.80 next-pivot threshold defines the nearby downside structural reference, with 76.43 remaining the major visible support. Falling longer-term benchmarks and price below the yearly neutral zone reinforce the dominant bearish backdrop. The pivot summary’s resistance figures listed above differ from the visible nearby chart resistance labels of 87.79, 90.86, 92.19, 94.09 and 101.64. Weekly and monthly grids and the named recent trade signals are not visible, so their direction cannot be independently verified; their neutral entries are placeholders rather than confirmed readings. No news or seasonal catalyst can be established from this chart alone.
Chart Analysis ATS AI Generated: 2026-11-12 15:15 for Informational use only, not trading advice. Terms and Risk Disclosure Copyright © 2026. Algo Trading Systems LLC.