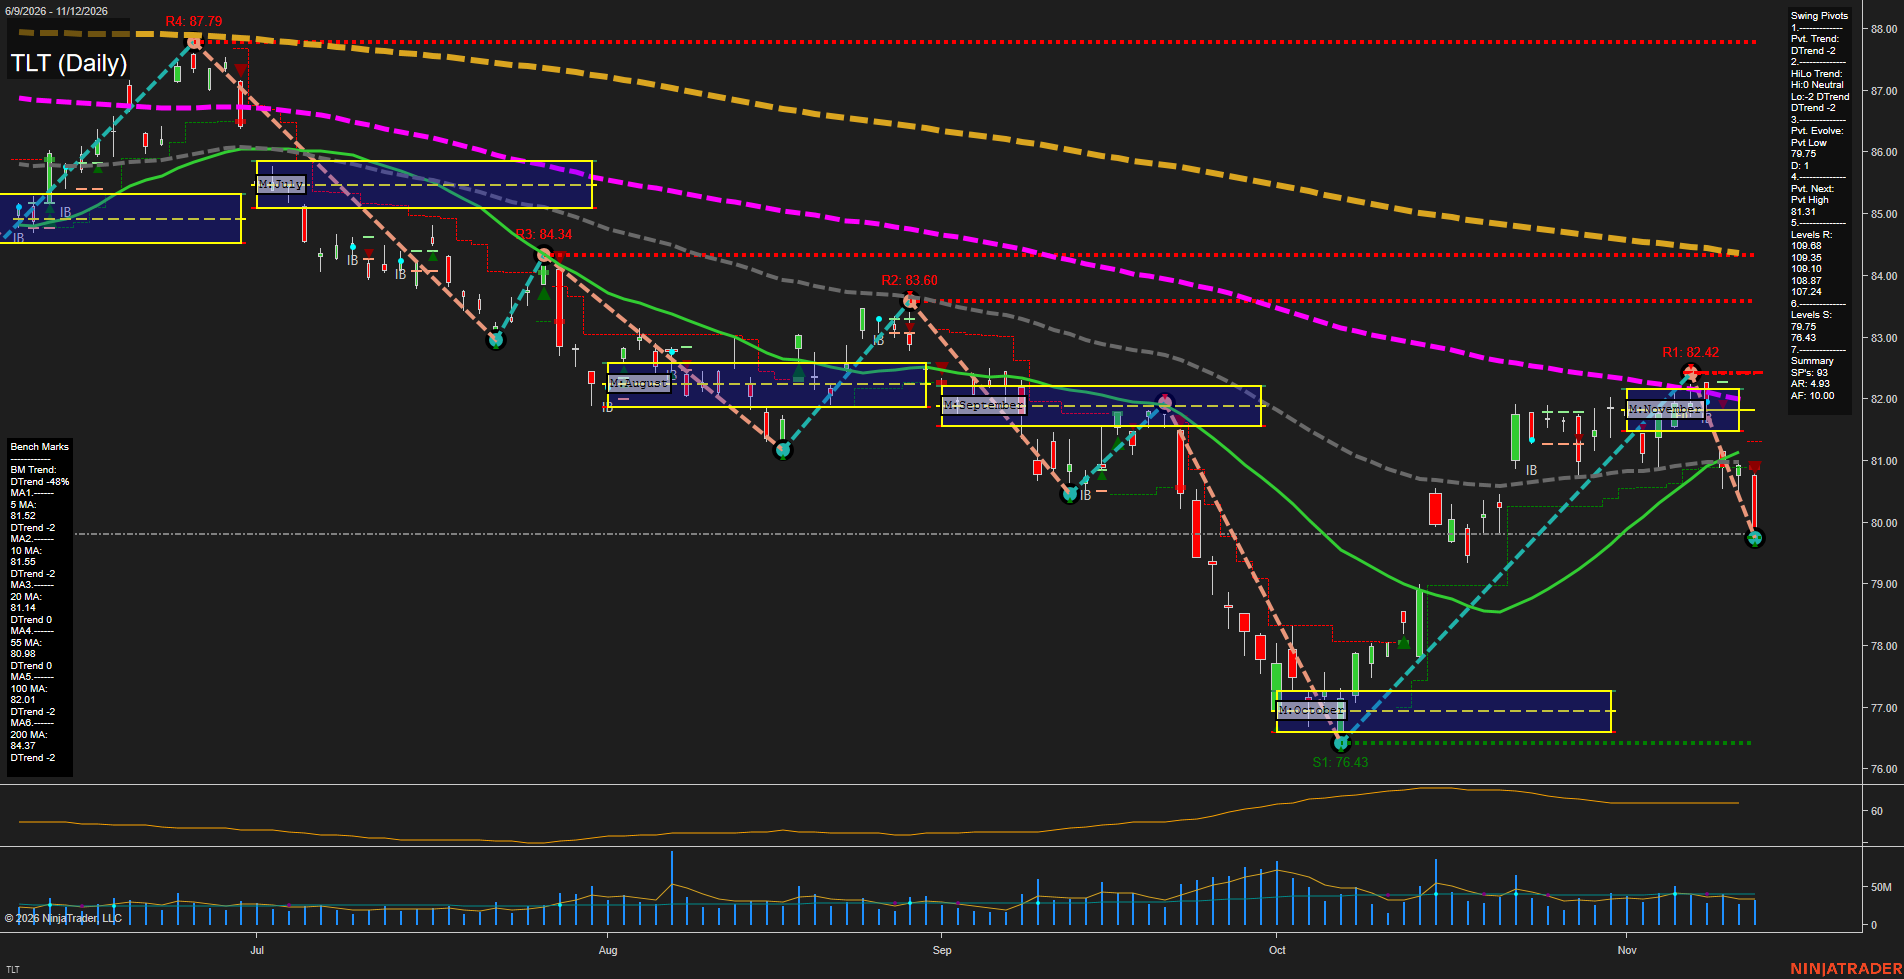
TLT TLT Daily Chart Analysis: 2026-Nov-12 15:14 CT
Price Action
- Last: Approximately 79.83,
- Bars: Large,
- Mom: Momentum fast to the downside.
WSFG Weekly
- Short-Term
- WSFG Current: NA%
- F0%/NTZ' Bias: Price Neutral,
- WSFG Trend: Neutral.
MSFG Month Nov
- Intermediate-Term
- MSFG Current: NA%
- F0%/NTZ' Bias: Price below F0% and NTZ,
- MSFG Trend: Bearish.
YSFG Year 2026
- Long-Term
- YSFG Current: NA%
- F0%/NTZ' Bias: Price Neutral,
- YSFG Trend: Neutral.
Swing Pivots
- (Short-Term) 1. Pvt. Trend: DTrend,
- (Intermediate-Term) 2. HiLo Trend: DTrend,
- 3. Pvt. Evolve: Pvt low 79.75,
- 4. Pvt. Next: Pvt high 81.31,
- 5. Levels R: 109.68, 109.35, 109.10, 108.87, 107.24,
- 6. Levels S: 79.75, 76.43.
Daily Benchmarks
- (Short-Term) 5 Day: 81.52 Down Trend,
- (Short-Term) 10 Day: 81.55 Down Trend,
- (Intermediate-Term) 20 Day: 81.14 Down Trend,
- (Intermediate-Term) 55 Day: 80.98 Down Trend,
- (Long-Term) 100 Day: 82.01 Down Trend,
- (Long-Term) 200 Day: 84.37 Down Trend.
Additional Metrics
- ATR: 65,
- VOLMA: 38827181.
Overall Rating
- Short-Term: Bearish,
- Intermediate-Term: Bearish,
- Long-Term: Bearish.
Key Insights Summary
From a futures swing-trading perspective, this Treasury ETF shows renewed downside expansion within a broader bearish structure. The October recovery from 76.43 to 82.42 has reversed sharply, with price below every benchmark and beneath November’s monthly neutral zone. Both pivot trends remain bearish, while 79.75 marks the evolving swing low above October support at 76.43. The chart’s visible resistance levels are 82.42, 83.60, 84.34 and 87.79; these conflict with the resistance values printed in the Swing Pivots summary and reported above. The 81.31 next-pivot threshold identifies the indicator’s potential reversal point, not a confirmed reversal. Recent selling has erased much of the recovery, supporting a countertrend-bounce interpretation rather than an established bullish trend change. Weekly and yearly grids, named USAR signals, and news or seasonal drivers cannot be verified from this image. TLT provides a duration-sensitive bond-market proxy, not a Treasury futures contract or its execution levels.
Chart Analysis ATS AI Generated: 2026-11-12 15:14 for Informational use only, not trading advice. Terms and Risk Disclosure Copyright © 2026. Algo Trading Systems LLC.