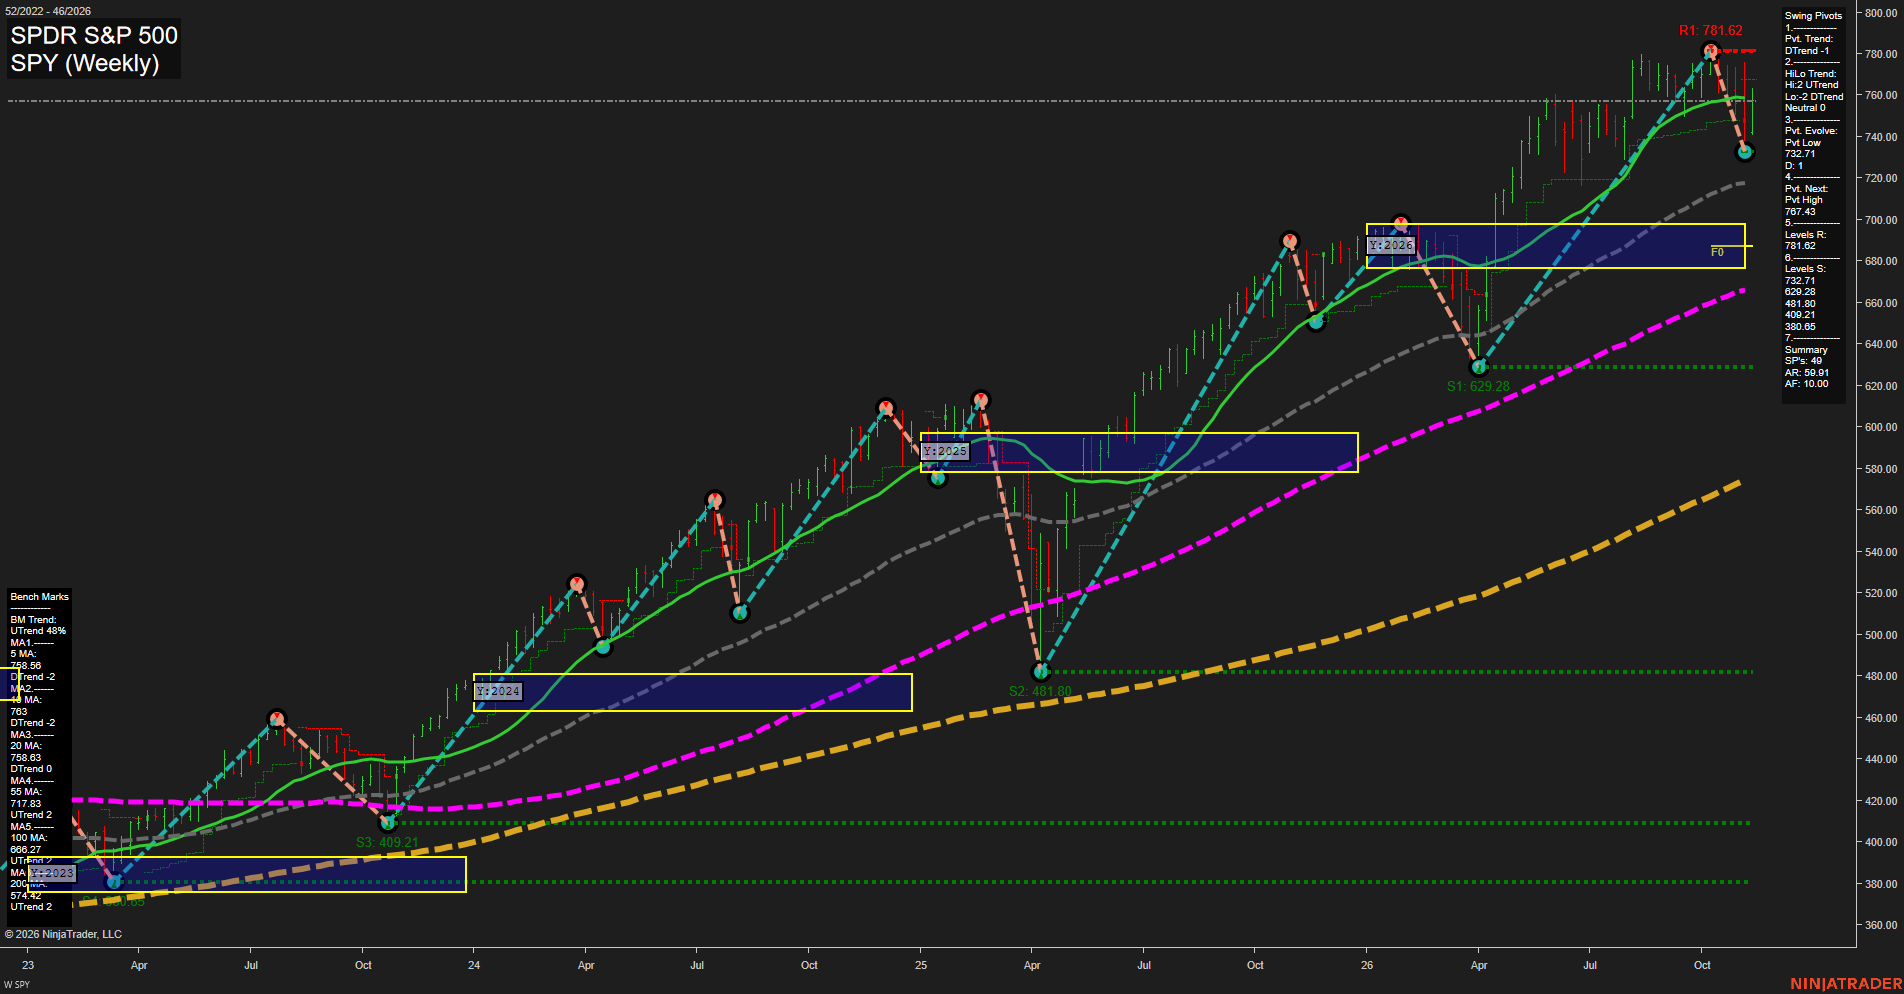
SPY SPDR S&P 500 Weekly Chart Analysis: 2026-Nov-12 15:14 CT
Price Action
- Last: Approximately 763; exact black price marker not visible,
- Bars: Large,
- Mom: Fast downside momentum followed by a sharp rebound.
WSFG Weekly
- Short-Term
- WSFG Current: NA%
- F0%/NTZ' Bias: Price Neutral,
- WSFG Trend: Neutral.
MSFG Month Nov
- Intermediate-Term
- MSFG Current: NA%
- F0%/NTZ' Bias: Price Neutral,
- MSFG Trend: Neutral.
YSFG Year 2026
- Long-Term
- YSFG Current: NA%
- F0%/NTZ' Bias: Price above NTZ,
- YSFG Trend: Bullish.
Swing Pivots
- (Short-Term) 1. Pvt. Trend: DTrend,
- (Intermediate-Term) 2. HiLo Trend: Neutral; highs UTrend and lows DTrend,
- 3. Pvt. Evolve: Pvt low 732.71,
- 4. Pvt. Next: Pvt high 767.43,
- 5. Levels R: 781.62,
- 6. Levels S: 732.71, 629.28, 481.80, 409.21, 380.65.
Weekly Benchmarks
- (Short-Term) 5 Day: 758.56 Down Trend,
- (Short-Term) 10 Day: 763.00 Down Trend,
- (Intermediate-Term) 20 Day: 758.63 Down Trend,
- (Intermediate-Term) 55 Day: 717.83 Up Trend,
- (Long-Term) 100 Day: 666.27 Up Trend,
- (Long-Term) 200 Day: 574.42 Up Trend.
Overall Rating
- Short-Term: Bearish,
- Intermediate-Term: Neutral,
- Long-Term: Bullish.
Key Insights Summary
From a futures swing trader’s perspective, this SPY chart depicts a volatile countertrend pullback within a broader rising equity trend, rather than a confirmed major-trend reversal. The decline from 781.62 to the evolving 732.71 pivot low represents roughly a 6.3% correction, followed by a sharp recovery toward the clustered short-term benchmarks around 759–763. The pivot trend remains down, with 767.43 identified by the summary as the next upside pivot-reversal threshold; 781.62 remains overhead resistance. Mixed higher-high and lower-low pivot structure indicates intermediate-term expansion and two-way volatility rather than orderly trend continuation. Rising 55-, 100-, and 200-period benchmarks and price above the yearly neutral zone support the bullish longer-term assessment. Weekly and monthly grids and the specified recent signal series are not displayed, so their neutral entries reflect unavailable confirmation rather than observed neutral signals. These are SPY reference levels, not directly transferable futures contract prices; news and seasonal effects cannot be established from this chart alone.
Chart Analysis ATS AI Generated: 2026-11-12 15:14 for Informational use only, not trading advice. Terms and Risk Disclosure Copyright © 2026. Algo Trading Systems LLC.