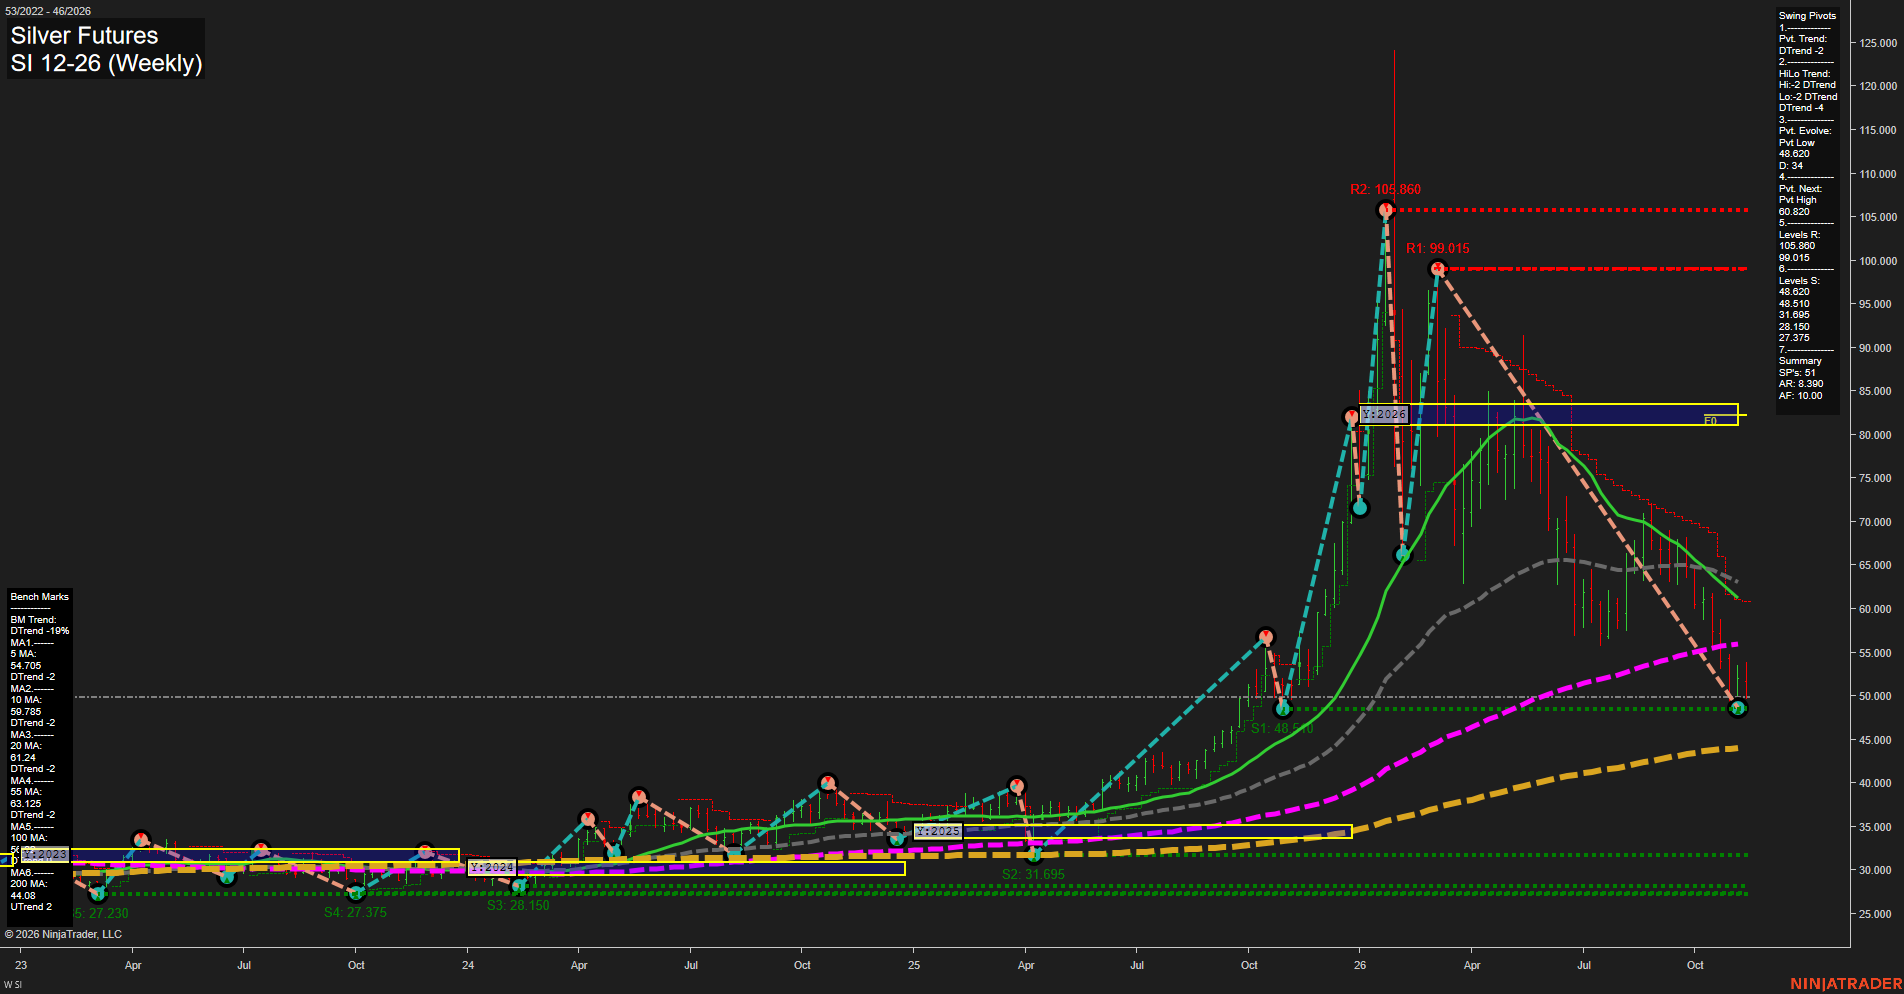
SI Silver Futures Weekly Chart Analysis: 2026-Nov-12 15:13 CT
Price Action
- Last: Approximately 50.000; exact black price marker not legible,
- Bars: Large,
- Mom: Momentum fast to the downside.
WSFG Weekly
- Short-Term
- WSFG Current: -31%
- F0%/NTZ' Bias: Price Below,
- WSFG Trend: Down.
MSFG Month Nov
- Intermediate-Term
- MSFG Current: 7%
- F0%/NTZ' Bias: Price Above,
- MSFG Trend: Up.
YSFG Year 2026
- Long-Term
- YSFG Current: -269%
- F0%/NTZ' Bias: Price Below,
- YSFG Trend: Down.
Swing Pivots
- (Short-Term) 1. Pvt. Trend: DTrend,
- (Intermediate-Term) 2. HiLo Trend: DTrend,
- 3. Pvt. Evolve: Pvt low 48.620,
- 4. Pvt. Next: Pvt high 60.820,
- 5. Levels R: 105.860, 99.015,
- 6. Levels S: 48.620, 48.510, 31.695, 28.150, 27.375.
Weekly Benchmarks
- (Short-Term) 5 Day: 54.705 Down Trend,
- (Short-Term) 10 Day: 59.785 Down Trend,
- (Intermediate-Term) 20 Day: 61.240 Down Trend,
- (Intermediate-Term) 55 Day: 63.125 Down Trend,
- (Long-Term) 100 Day: Approximately 56.000 Up Trend,
- (Long-Term) 200 Day: 44.080 Up Trend.
Recent Trade Signals
- 12 Nov 2026: Short SI 12-26 @ 50.765 Signals.USAR-WSFG
- 12 Nov 2026: Short SI 12-26 @ 51.36 Signals.USAR.TR120
Overall Rating
- Short-Term: Bearish,
- Intermediate-Term: Bearish,
- Long-Term: Neutral.
Key Insights Summary
From a futures swing-trading perspective, the chart shows an established downswing rather than a confirmed recovery. The decline from 105.860 through the lower high at 99.015 supports the bearish pivot structure, with price now testing the closely grouped 48.620–48.510 support levels. Large weekly ranges and sustained losses indicate strong downside momentum, although proximity to support alone does not establish a reversal. Price is below the declining 5-, 10-, 20- and 55-period benchmarks and below the rising 100-period benchmark. The positive monthly grid reading is a countertrend feature against bearish weekly signals and intermediate-term structure. Longer-term evidence is mixed: the annual grid is deeply negative, but the 100- and 200-period benchmarks remain rising, with price still above the 200-period average at 44.080. The 60.820 next-pivot threshold remains above current price, leaving the developing pivot low unconfirmed as a bullish reversal. News catalysts and seasonal influences cannot be established from this chart alone.
Chart Analysis ATS AI Generated: 2026-11-12 15:13 for Informational use only, not trading advice. Terms and Risk Disclosure Copyright © 2026. Algo Trading Systems LLC.