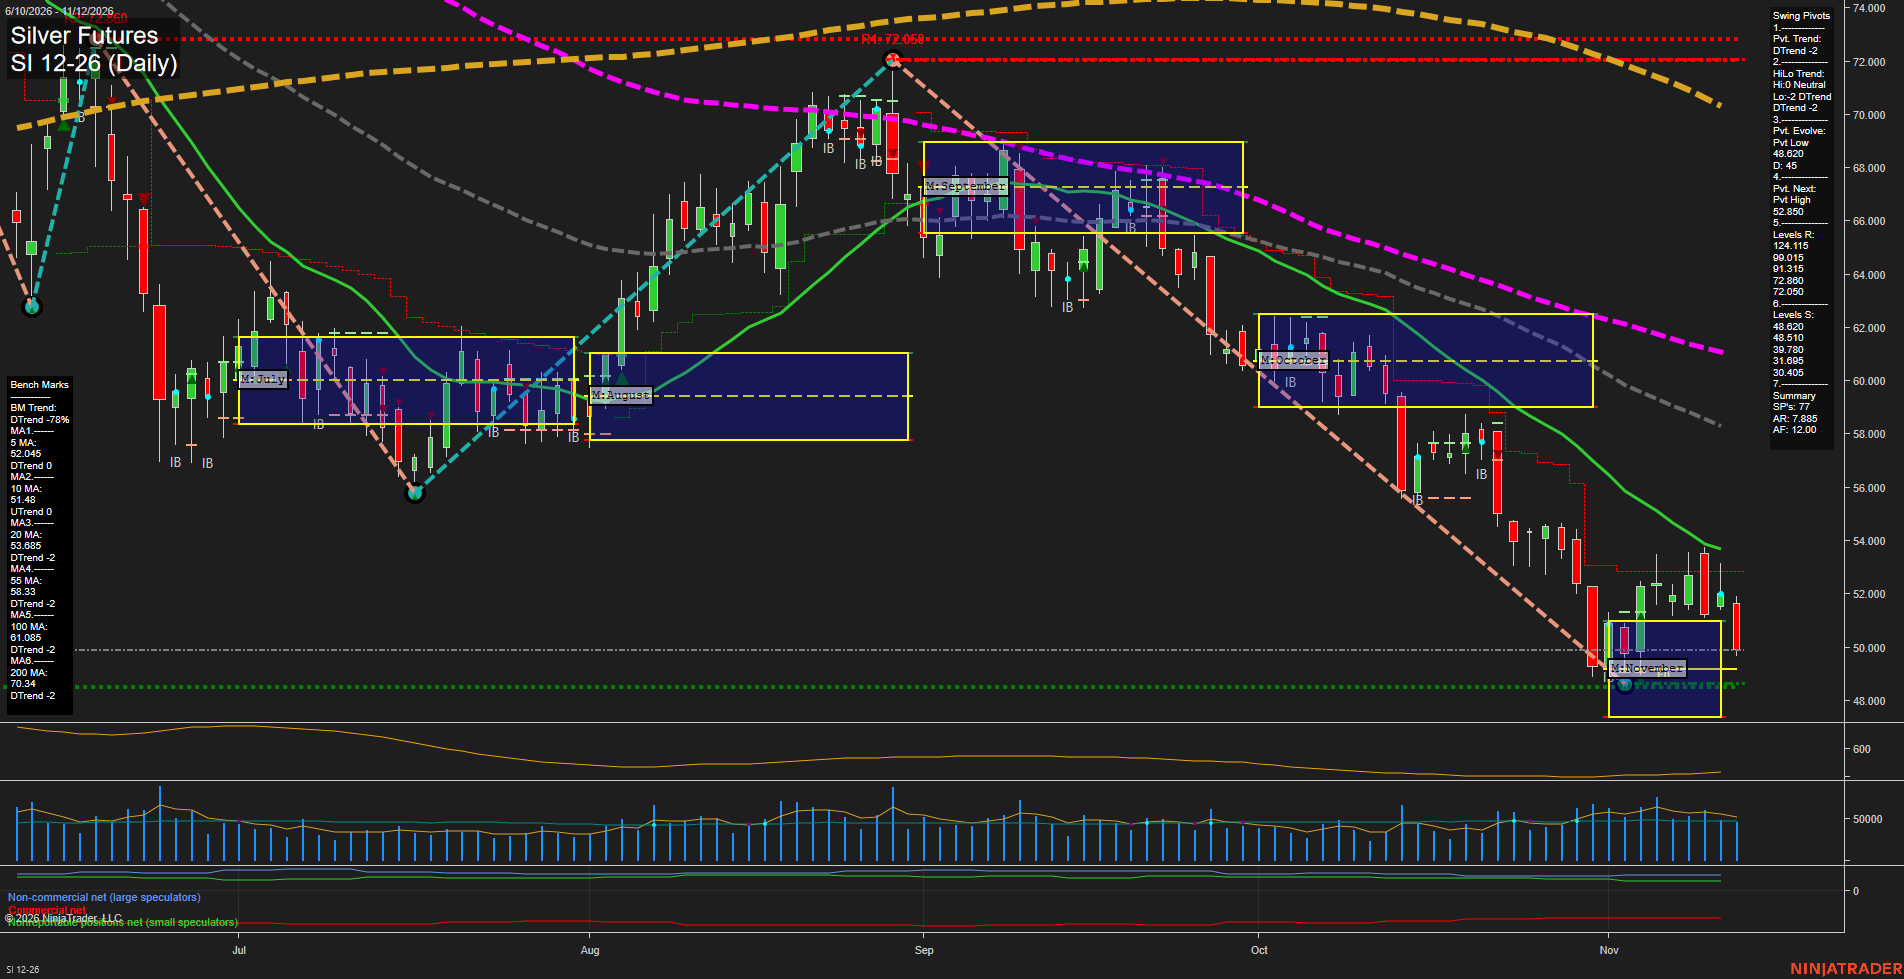
SI Silver Futures Daily Chart Analysis: 2026-Nov-12 15:13 CT
Price Action
- Last: approximately 49.900,
- Bars: Medium,
- Mom: Momentum fast.
WSFG Weekly
- Short-Term
- WSFG Current: -31%
- F0%/NTZ' Bias: Price Below,
- WSFG Trend: Down.
MSFG Month Nov
- Intermediate-Term
- MSFG Current: 7%
- F0%/NTZ' Bias: Price Above,
- MSFG Trend: Up.
YSFG Year 2026
- Long-Term
- YSFG Current: -269%
- F0%/NTZ' Bias: Price Below,
- YSFG Trend: Down.
Swing Pivots
- (Short-Term) 1. Pvt. Trend: DTrend,
- (Intermediate-Term) 2. HiLo Trend: DTrend,
- 3. Pvt. Evolve: Pvt low 48.620,
- 4. Pvt. Next: Pvt high 52.850,
- 5. Levels R: 124.115, 99.015, 91.315, 72.860, 72.050,
- 6. Levels S: 48.620, 48.510, 39.780, 31.695, 30.405.
Daily Benchmarks
- (Short-Term) 5 Day: 52.045 Down Trend,
- (Short-Term) 10 Day: 51.480 Up Trend,
- (Intermediate-Term) 20 Day: 53.685 Down Trend,
- (Intermediate-Term) 55 Day: 58.330 Down Trend,
- (Long-Term) 100 Day: 61.085 Down Trend,
- (Long-Term) 200 Day: 70.340 Down Trend.
Additional Metrics
Recent Trade Signals
- 12 Nov 2026: Short SI 12-26 @ 50.765 Signals.USAR-WSFG
- 12 Nov 2026: Short SI 12-26 @ 51.36 Signals.USAR.TR120
Overall Rating
- Short-Term: Bearish,
- Intermediate-Term: Bearish,
- Long-Term: Bearish.
Key Insights Summary
From a futures swing-trading perspective, silver remains in a broad declining price cycle, with the latest bearish daily bar reversing much of November's rebound. Price is below all six benchmarks, while both pivot trends remain down. The rising 10-day benchmark and positive monthly grid describe a countertrend recovery rather than a confirmed reversal; weekly grid weakness and both new short signals indicate renewed short-term downside momentum. The 48.620–48.510 support cluster marks the recent swing-low area, while 52.850 is the next pivot-reversal threshold. Falling intermediate- and long-term averages reinforce the broader bearish structure. ATR of 419 reflects substantial daily movement, although the chart does not establish a volume-climax reversal. News catalysts and seasonal influences cannot be verified from this chart alone.
Chart Analysis ATS AI Generated: 2026-11-12 15:13 for Informational use only, not trading advice. Terms and Risk Disclosure Copyright © 2026. Algo Trading Systems LLC.