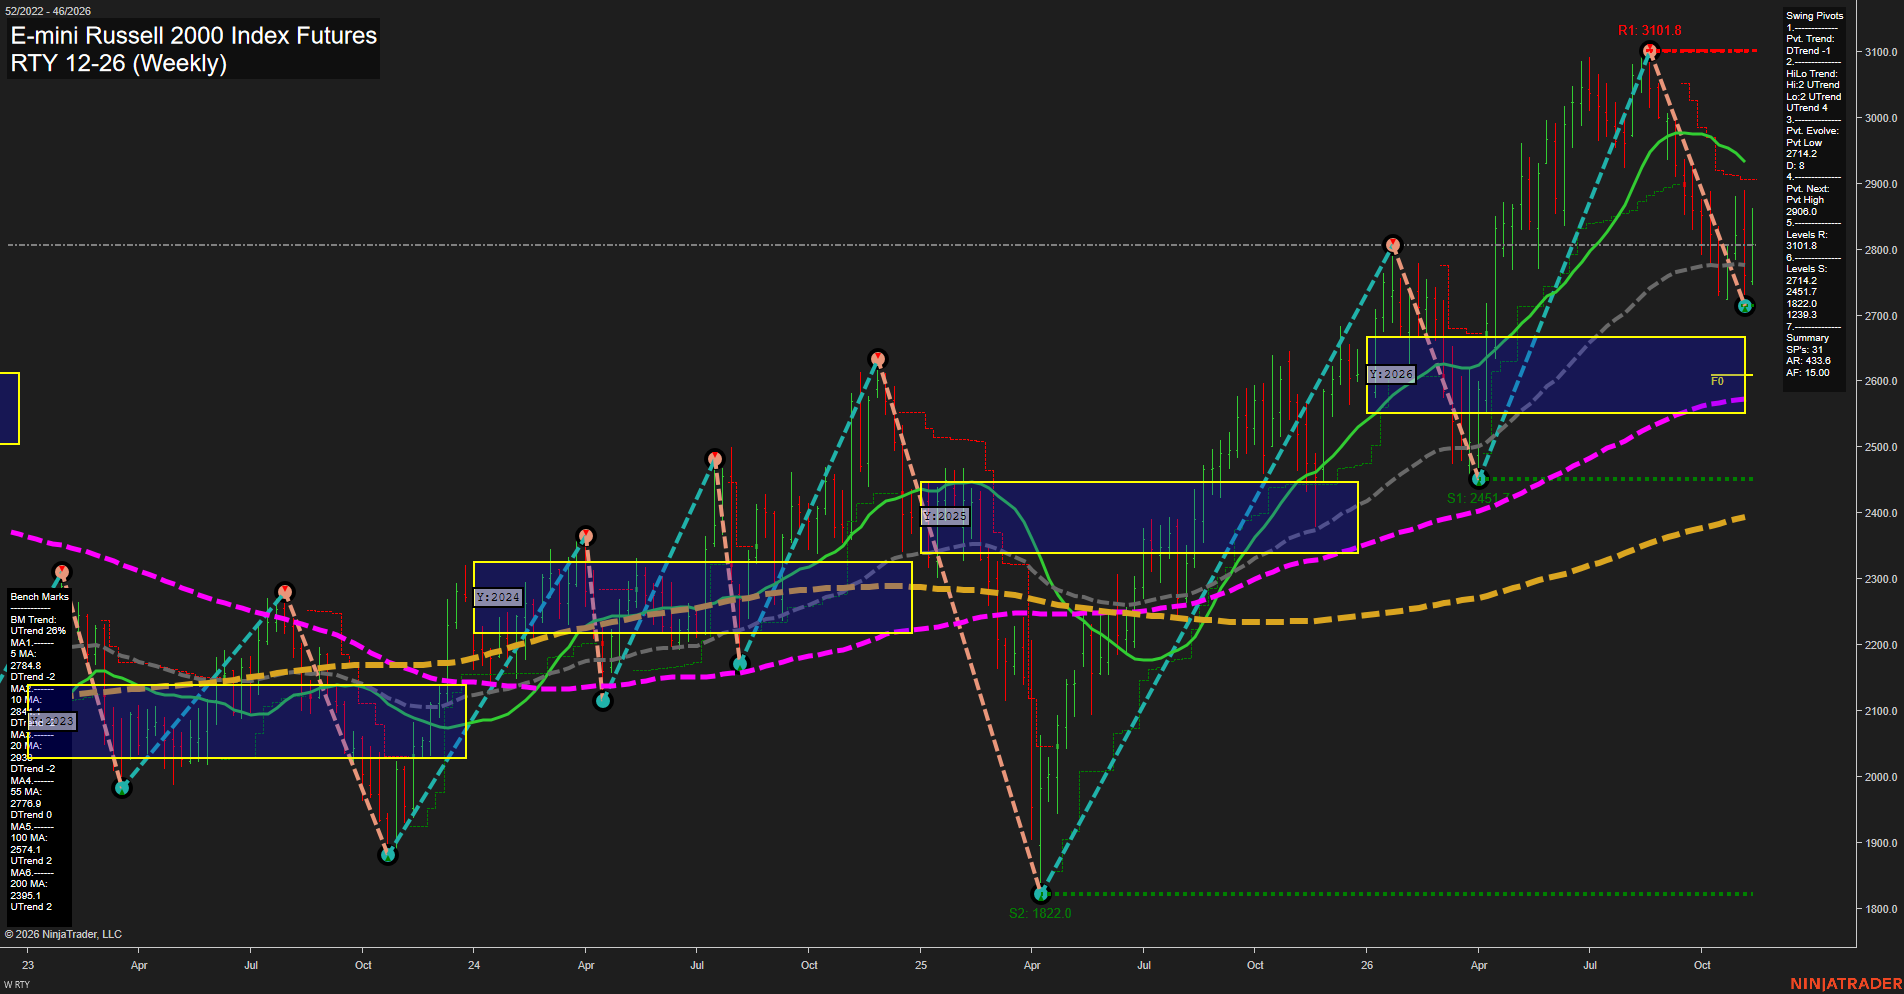
RTY E-mini Russell 2000 Index Futures Weekly Chart Analysis: 2026-Nov-12 15:12 CT
Price Action
- Last: Not legible; black price marker not visible,
- Bars: Large,
- Mom: Fast downside momentum with a recent rebound.
WSFG Weekly
- Short-Term
- WSFG Current: 50%
- F0%/NTZ' Bias: Price Above,
- WSFG Trend: Up.
MSFG Month Nov
- Intermediate-Term
- MSFG Current: -14%
- F0%/NTZ' Bias: Price Below,
- MSFG Trend: Down.
YSFG Year 2026
- Long-Term
- YSFG Current: 35%
- F0%/NTZ' Bias: Price Above,
- YSFG Trend: Up.
Swing Pivots
- (Short-Term) 1. Pvt. Trend: DTrend,
- (Intermediate-Term) 2. HiLo Trend: UTrend,
- 3. Pvt. Evolve: Pvt low 2714.2,
- 4. Pvt. Next: Pvt high 2906.0,
- 5. Levels R: 3101.8,
- 6. Levels S: 2714.2, 2451.7, 1822.0, 1239.3.
Weekly Benchmarks
- (Short-Term) 5 Day: 2784.8 Down Trend,
- (Short-Term) 10 Day: 2841.4 Down Trend,
- (Intermediate-Term) 20 Day: Price obscured Down Trend,
- (Intermediate-Term) 55 Day: 2776.9 Down Trend,
- (Long-Term) 100 Day: 2574.1 Up Trend,
- (Long-Term) 200 Day: 2395.1 Up Trend.
Recent Trade Signals
- 12 Nov 2026: Short RTY 12-26 @ 2807.7 Signals.USAR-MSFG
- 12 Nov 2026: Short RTY 12-26 @ 2821.1 Signals.USAR.TR120
- 09 Nov 2026: Long RTY 12-26 @ 2773.6 Signals.USAR-WSFG
Overall Rating
- Short-Term: Bearish,
- Intermediate-Term: Bearish,
- Long-Term: Bullish.
Key Insights Summary
From a futures swing-trading perspective, this is a sharp corrective downswing within a still-positive longer-term structure. The decline from 3101.8 to the evolving 2714.2 pivot low is approximately 12.5%, with large weekly ranges reflecting elevated volatility. Weekly grid strength and the recent WSFG long signal indicate a countertrend rebound, but the downward pivot trend, declining shorter benchmarks and newer TR120 short signal leave short-term evidence predominantly bearish. Intermediate-term conditions are also bearish despite the higher-high/higher-low pivot structure remaining positive. The summary identifies 2906.0 as the next opposite-pivot reversal threshold, distinct from established resistance at 3101.8. Longer-term strength remains supported by rising 100- and 200-period benchmarks and price above the yearly neutral zone. No TR720 signal or news evidence is supplied, so neither news catalysts nor seasonal explanations can be confirmed.
Chart Analysis ATS AI Generated: 2026-11-12 15:13 for Informational use only, not trading advice. Terms and Risk Disclosure Copyright © 2026. Algo Trading Systems LLC.