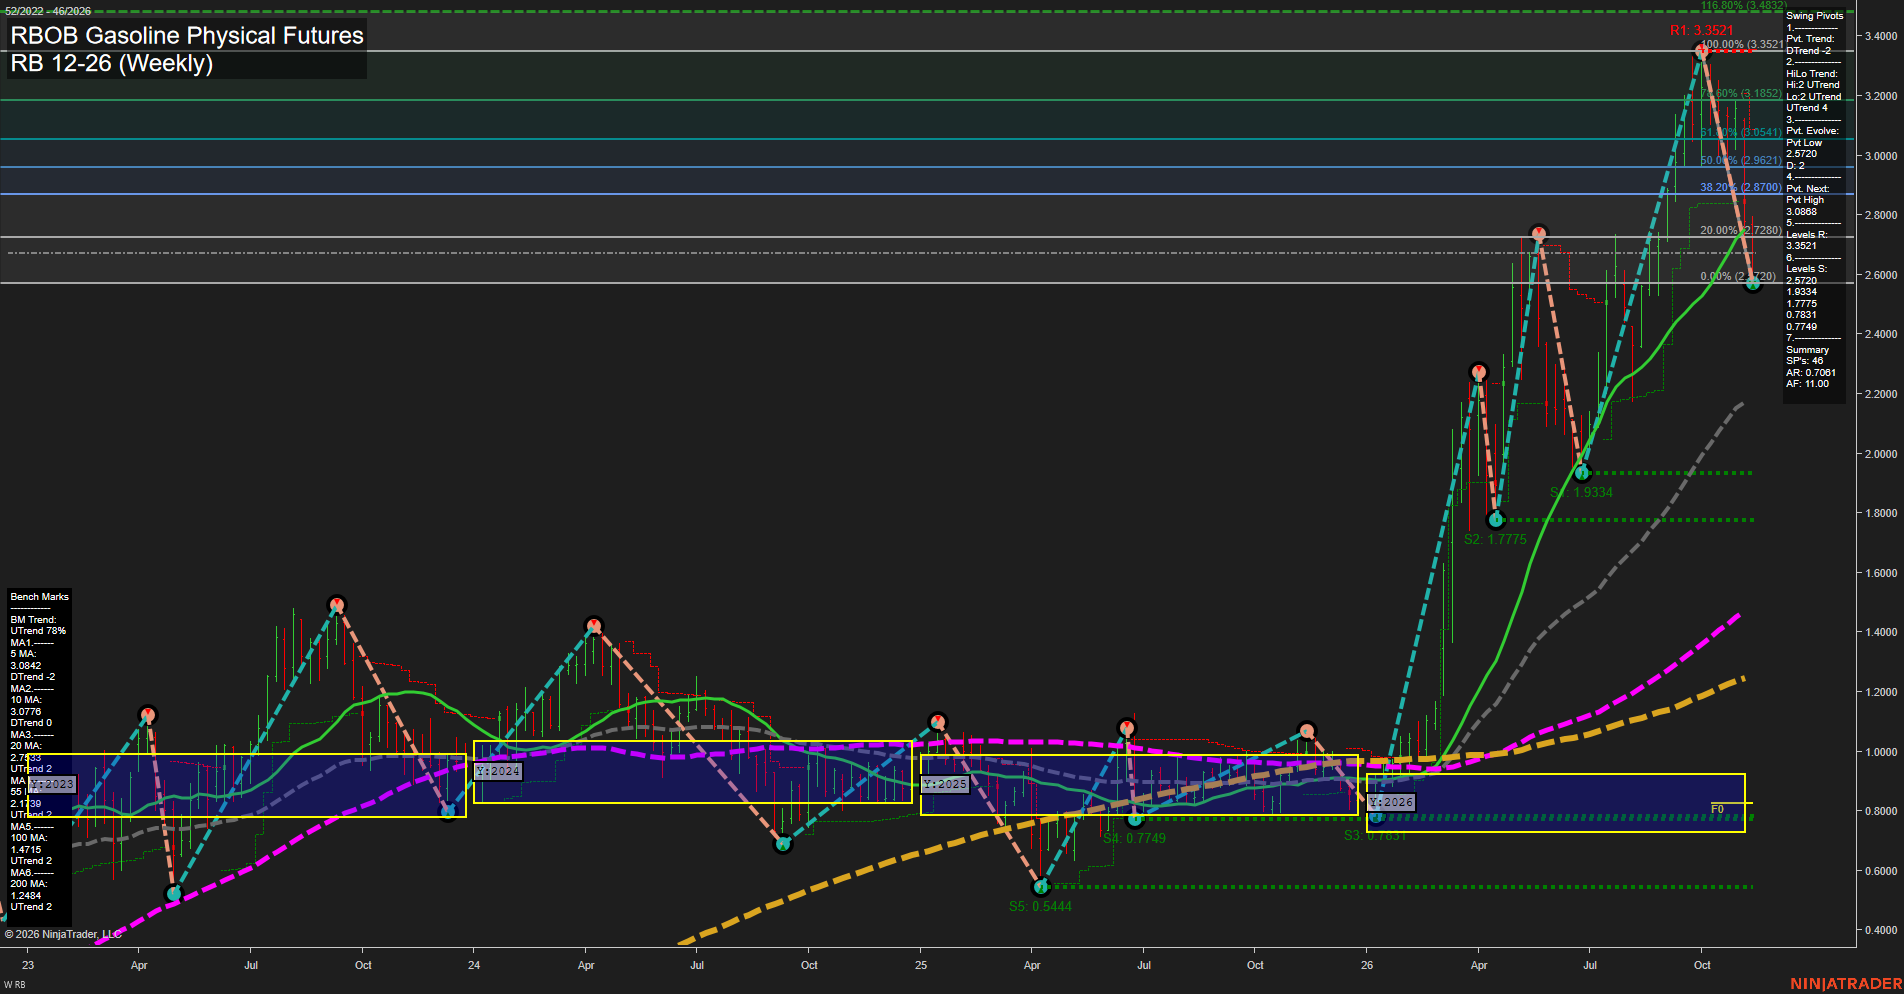
RB RBOB Gasoline Physical Futures Weekly Chart Analysis: 2026-Nov-12 15:12 CT
Price Action
- Last: Not clearly legible; price is near the 2.5720 pivot low,
- Bars: Large,
- Mom: Momentum fast.
WSFG Weekly
- Short-Term
- WSFG Current: -39%
- F0%/NTZ' Bias: Price Below,
- WSFG Trend: Down.
MSFG Month Nov
- Intermediate-Term
- MSFG Current: -91%
- F0%/NTZ' Bias: Price Below,
- MSFG Trend: Down.
YSFG Year 2026
- Long-Term
- YSFG Current: 190%
- F0%/NTZ' Bias: Price Above,
- YSFG Trend: Up.
Swing Pivots
- (Short-Term) 1. Pvt. Trend: DTrend,
- (Intermediate-Term) 2. HiLo Trend: UTrend,
- 3. Pvt. Evolve: Pvt low 2.5720,
- 4. Pvt. Next: Pvt high 3.0868,
- 5. Levels R: 3.3521,
- 6. Levels S: 2.5720, 1.9334, 1.7775, 0.7831, 0.7749.
Weekly Benchmarks
- (Short-Term) 5 Day: 3.0842 Down Trend,
- (Short-Term) 10 Day: 3.0776 Down Trend,
- (Intermediate-Term) 20 Day: 2.7583 Up Trend,
- (Intermediate-Term) 55 Day: 2.1789 Up Trend,
- (Long-Term) 100 Day: 1.4715 Up Trend,
- (Long-Term) 200 Day: 1.2484 Up Trend.
Recent Trade Signals
- 09 Nov 2026: Short RB 12-26 @ 2.7419 Signals.USAR-WSFG
Overall Rating
- Short-Term: Bearish,
- Intermediate-Term: Bullish,
- Long-Term: Bullish.
Key Insights Summary
The weekly structure shows a sharp countertrend selloff within a broader rising market. Price has retreated approximately 23% from the 3.3521 swing high to the evolving 2.5720 low, with large bars reflecting elevated volatility and fast downside momentum. Falling short-term benchmarks, negative weekly and monthly grids, and the recent short signal reinforce the immediate bearish phase. Intermediate-term structure remains bullish on balance because the higher-high/higher-low pivot trend and both intermediate benchmarks remain upward, although monthly weakness indicates substantial deterioration. Rising long-term benchmarks and price above the yearly neutral zone preserve the larger bullish backdrop. The 2.5720 pivot is the immediate structural reference, followed by 1.9334 and 1.7775; 3.0868 is the displayed opposite-pivot reversal threshold, while 3.3521 remains overhead swing resistance. The chart alone does not establish a news catalyst or confirm a seasonal explanation.
Chart Analysis ATS AI Generated: 2026-11-12 15:12 for Informational use only, not trading advice. Terms and Risk Disclosure Copyright © 2026. Algo Trading Systems LLC.