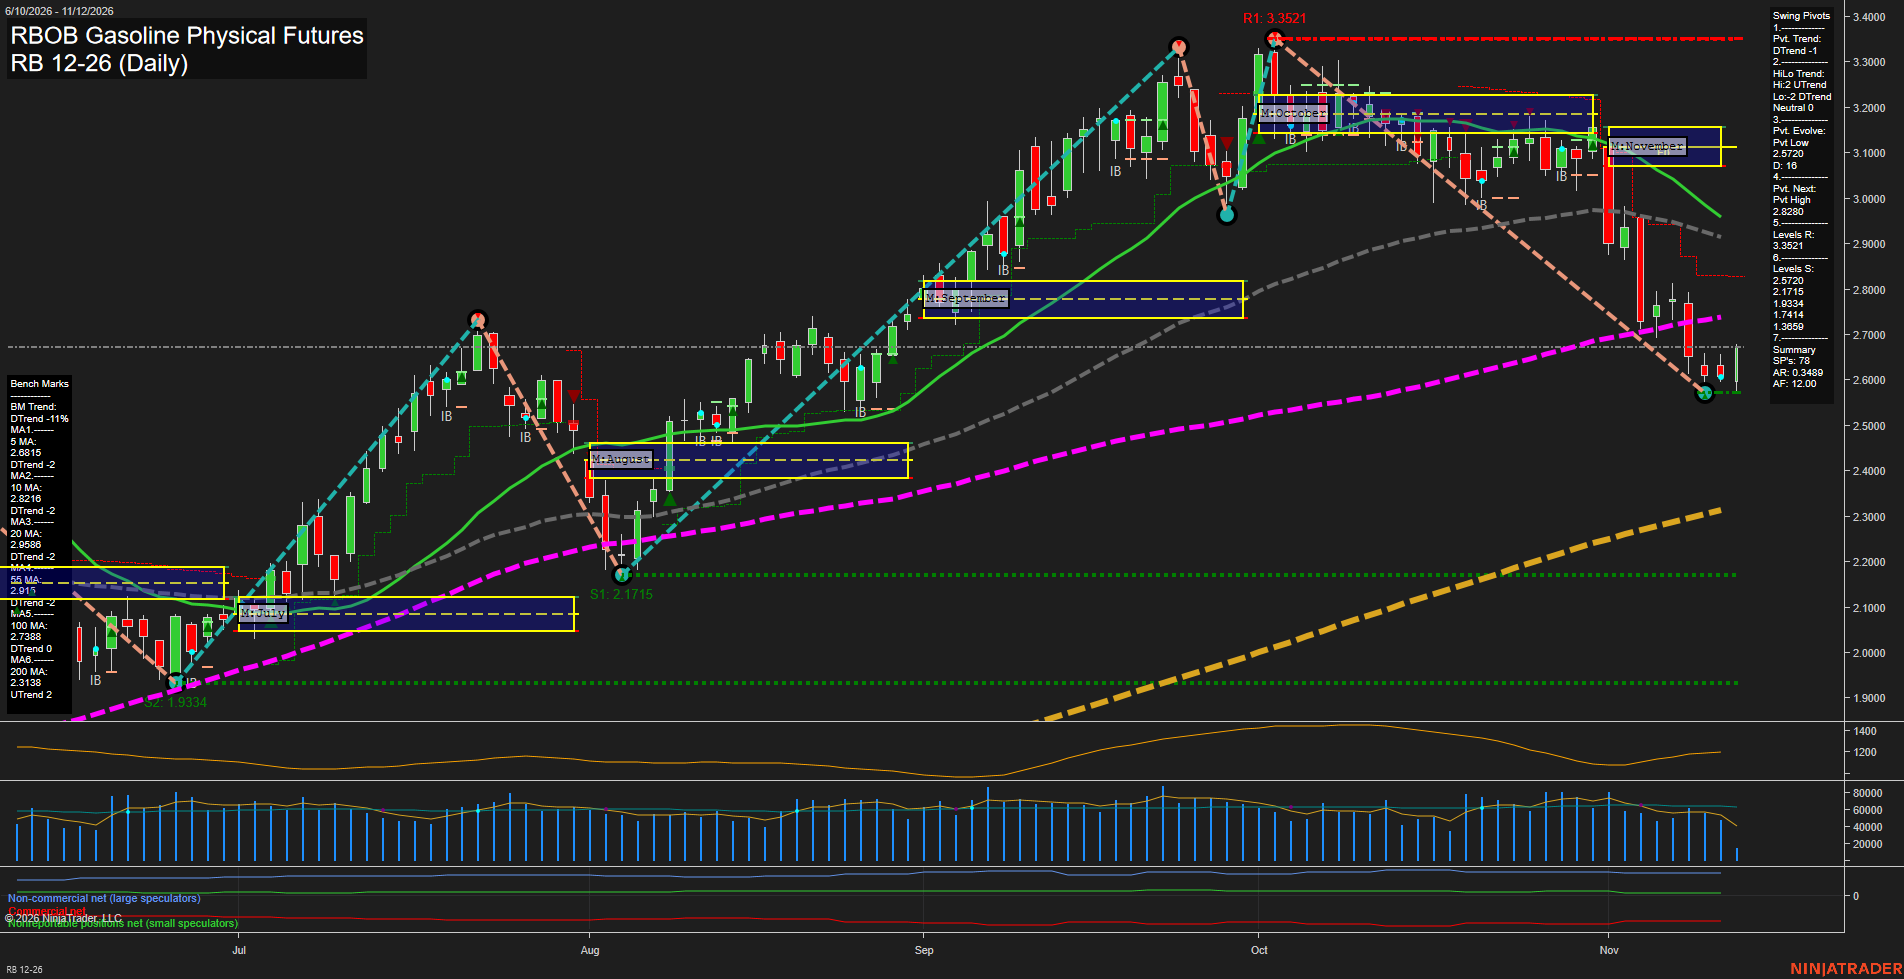
RB RBOB Gasoline Physical Futures Daily Chart Analysis: 2026-Nov-12 15:12 CT
Price Action
- Last: Approximately 2.6750,
- Bars: Medium,
- Mom: Momentum slow.
WSFG Weekly
- Short-Term
- WSFG Current: -39%
- F0%/NTZ' Bias: Price Below,
- WSFG Trend: Down.
MSFG Month Nov
- Intermediate-Term
- MSFG Current: -91%
- F0%/NTZ' Bias: Price Below,
- MSFG Trend: Down.
YSFG Year 2026
- Long-Term
- YSFG Current: 190%
- F0%/NTZ' Bias: Price Above,
- YSFG Trend: Up.
Swing Pivots
- (Short-Term) 1. Pvt. Trend: DTrend,
- (Intermediate-Term) 2. HiLo Trend: Neutral,
- 3. Pvt. Evolve: Pvt low 2.5720,
- 4. Pvt. Next: Pvt high 2.8280,
- 5. Levels R: 3.3521,
- 6. Levels S: 2.5720, 2.1715, 1.9334, 1.7414, 1.3659.
Daily Benchmarks
- (Short-Term) 5 Day: 2.6815 Down Trend,
- (Short-Term) 10 Day: 2.8216 Down Trend,
- (Intermediate-Term) 20 Day: 2.9588 Down Trend,
- (Intermediate-Term) 55 Day: 2.9150 Down Trend,
- (Long-Term) 100 Day: 2.7388 Down Trend,
- (Long-Term) 200 Day: 2.3138 Up Trend.
Additional Metrics
Recent Trade Signals
- 09 Nov 2026: Short RB 12-26 @ 2.7419 Signals.USAR-WSFG
Overall Rating
- Short-Term: Bearish,
- Intermediate-Term: Bearish,
- Long-Term: Bullish.
Key Insights Summary
The swing structure remains corrective following the decline from 3.3521 to the evolving 2.5720 pivot low. Recent smaller candles and a rebound indicate slowing downside momentum, but price remains below the weekly and monthly neutral zones and the 5-, 10-, 20-, 55- and 100-day benchmarks. This characterizes the recovery as a countertrend bounce rather than a confirmed reversal; the summary identifies 2.8280 as the next opposite-pivot threshold. Intermediate-term HiLo structure is neutral, reflecting a higher major high alongside a declining low sequence, while falling intermediate benchmarks keep that horizon bearish. The long-term bullish rating reflects the positive yearly grid and rising 200-day benchmark, although weakness beneath the 100-day average shows deterioration within that broader trend. November demand seasonality can contextualize gasoline weakness, but the chart does not establish a specific news catalyst.
Chart Analysis ATS AI Generated: 2026-11-12 15:12 for Informational use only, not trading advice. Terms and Risk Disclosure Copyright © 2026. Algo Trading Systems LLC.