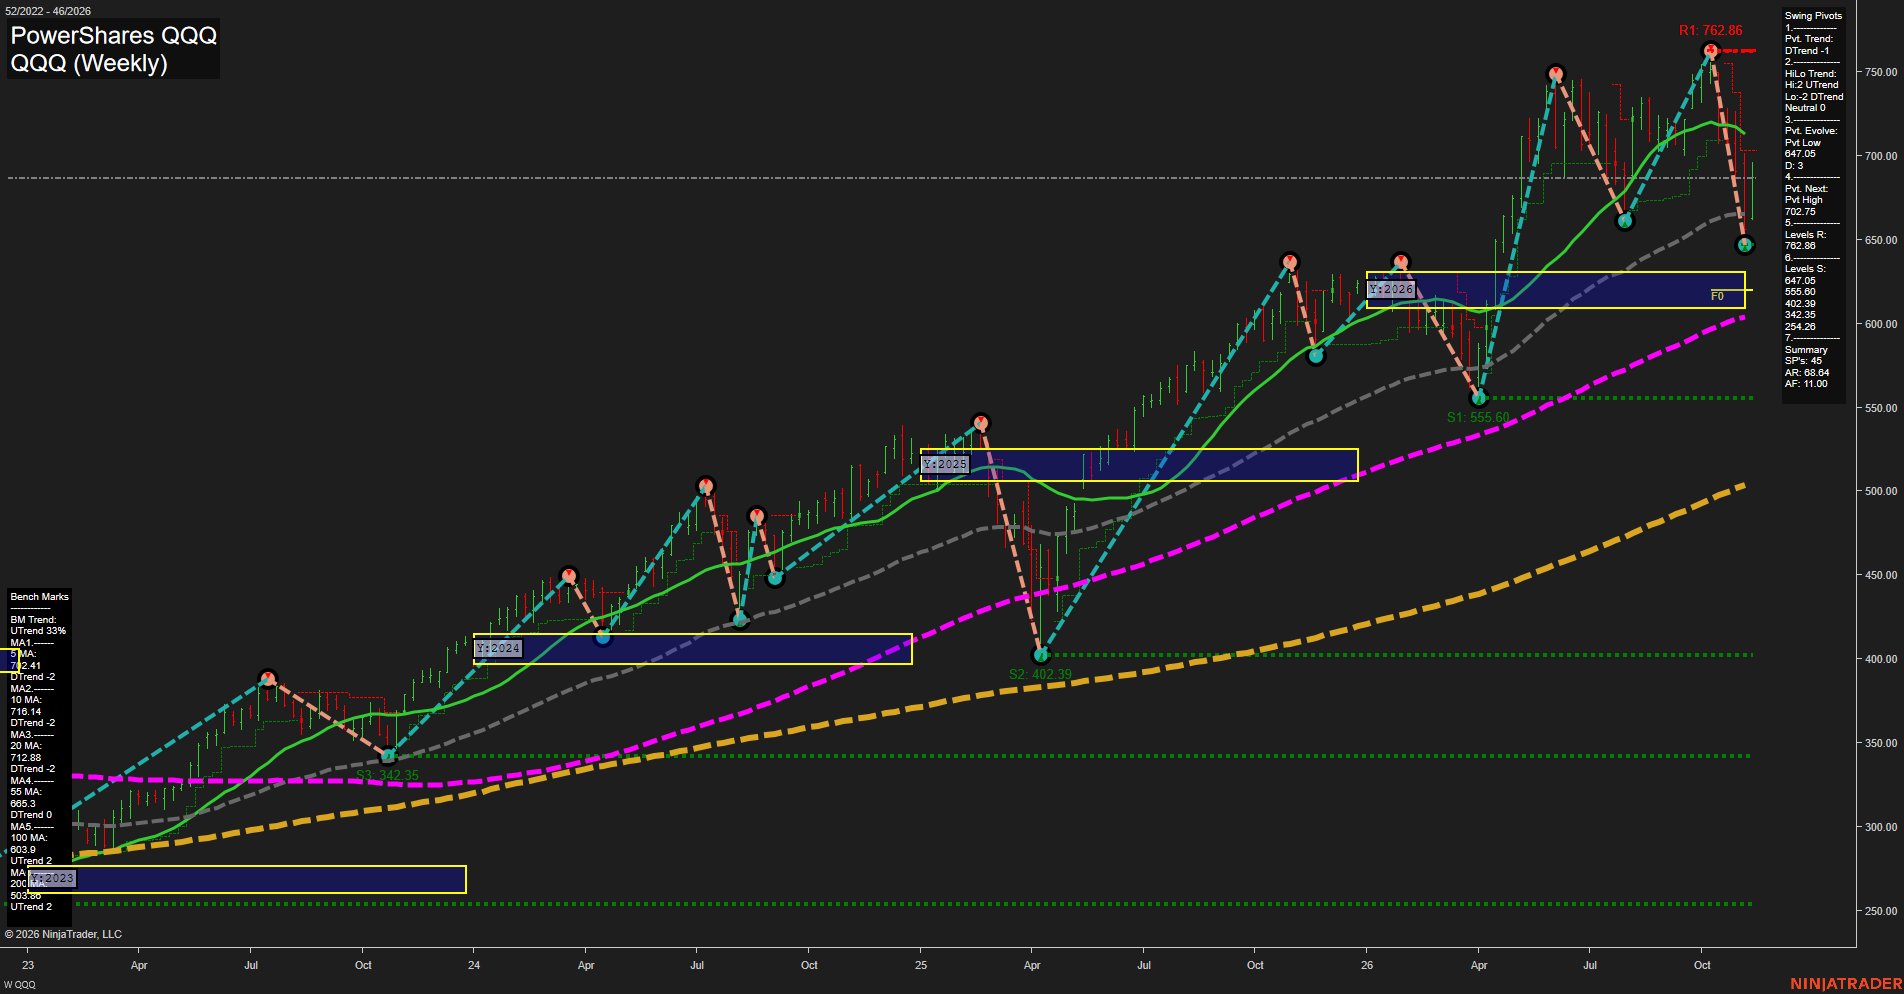
QQQ PowerShares QQQ Weekly Chart Analysis: 2026-Nov-12 15:11 CT
Price Action
- Last: Not legible on the supplied price axis,
- Bars: Large,
- Mom: Momentum fast on the downswing.
WSFG Weekly
- Short-Term
- WSFG Current: NA%
- F0%/NTZ' Bias: Price Neutral,
- WSFG Trend: Neutral.
MSFG Month Nov
- Intermediate-Term
- MSFG Current: NA%
- F0%/NTZ' Bias: Price Neutral,
- MSFG Trend: Neutral.
YSFG Year 2026
- Long-Term
- YSFG Current: NA%
- F0%/NTZ' Bias: Price Neutral,
- YSFG Trend: Neutral.
Swing Pivots
- (Short-Term) 1. Pvt. Trend: DTrend,
- (Intermediate-Term) 2. HiLo Trend: Neutral; highs UTrend, lows DTrend,
- 3. Pvt. Evolve: Pvt low 647.05,
- 4. Pvt. Next: Pvt high 702.75,
- 5. Levels R: 762.86,
- 6. Levels S: 647.05, 555.60, 402.39, 342.35, 254.26.
Weekly Benchmarks
- (Short-Term) 5 Day: 702.41 Down Trend,
- (Short-Term) 10 Day: 716.14 Down Trend,
- (Intermediate-Term) 20 Day: 712.88 Down Trend,
- (Intermediate-Term) 55 Day: 665.3 Down Trend,
- (Long-Term) 100 Day: 603.9 Up Trend,
- (Long-Term) 200 Day: Approximately 503.6 Up Trend.
Overall Rating
- Short-Term: Bearish,
- Intermediate-Term: Bearish,
- Long-Term: Bullish.
Key Insights Summary
From a futures swing trader’s perspective, QQQ depicts a fast corrective downswing within a still-rising long-term structure, rather than a confirmed reversal of the entire multiyear advance. The decline from 762.86 to the evolving 647.05 pivot low undercut the preceding swing low, while the higher-high sequence remains intact; that combination explains the neutral intermediate pivot classification and expanding volatility. Falling short- and intermediate-term benchmarks reinforce bearish near-term momentum, whereas rising 100- and 200-period benchmarks preserve the broader bullish backdrop. The next opposite-pivot threshold is 702.75, distinct from established resistance at 762.86. The 2026 yearly NTZ lies approximately around 610–631, below the developing pivot low. Grid summaries remain neutral placeholders because their trend metrics are not displayed. Recent trade-signal readings, news catalysts, and seasonal confirmation are unavailable in this image. QQQ levels describe the ETF and are not directly transferable to Nasdaq futures prices.
Chart Analysis ATS AI Generated: 2026-11-12 15:12 for Informational use only, not trading advice. Terms and Risk Disclosure Copyright © 2026. Algo Trading Systems LLC.