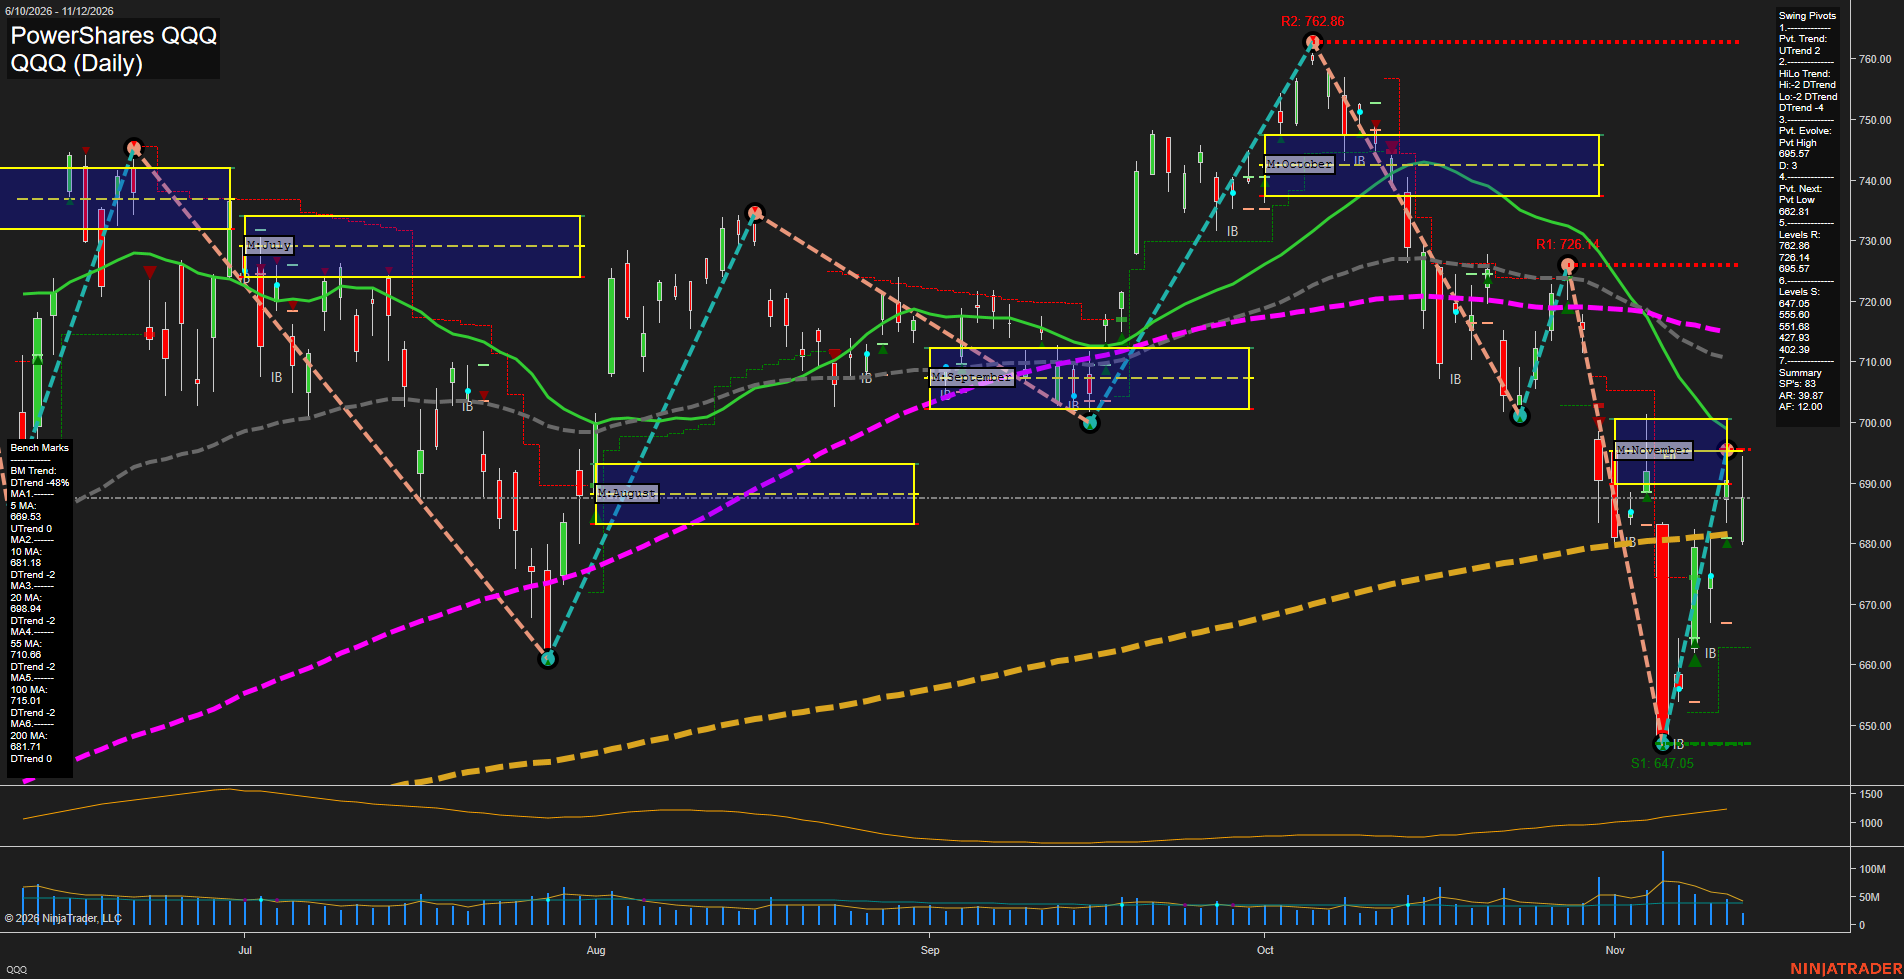
QQQ PowerShares QQQ Daily Chart Analysis: 2026-Nov-12 15:11 CT
Price Action
- Last: Approximately 688; exact price marker not visible,
- Bars: Large,
- Mom: Fast rebound, followed by a pullback.
WSFG Weekly
- Short-Term
- WSFG Current: NA%
- F0%/NTZ' Bias: Price Neutral,
- WSFG Trend: Neutral.
MSFG Month Nov
- Intermediate-Term
- MSFG Current: NA%
- F0%/NTZ' Bias: Price below NTZ,
- MSFG Trend: Bearish.
YSFG Year 2026
- Long-Term
- YSFG Current: NA%
- F0%/NTZ' Bias: Price Neutral,
- YSFG Trend: Neutral.
Swing Pivots
- (Short-Term) 1. Pvt. Trend: UTrend,
- (Intermediate-Term) 2. HiLo Trend: DTrend,
- 3. Pvt. Evolve: Pvt high 695.57,
- 4. Pvt. Next: Pvt low 662.81,
- 5. Levels R: 762.86, 726.14, 695.57,
- 6. Levels S: 647.05, 555.60, 551.68, 427.93, 402.39.
Daily Benchmarks
- (Short-Term) 5 Day: 689.53 Up Trend,
- (Short-Term) 10 Day: 681.18 Down Trend,
- (Intermediate-Term) 20 Day: 698.94 Down Trend,
- (Intermediate-Term) 55 Day: 710.66 Down Trend,
- (Long-Term) 100 Day: 715.01 Down Trend,
- (Long-Term) 200 Day: 681.71 Down Trend.
Additional Metrics
- ATR: 733,
- VOLMA: 32709273.
Overall Rating
- Short-Term: Neutral,
- Intermediate-Term: Bearish,
- Long-Term: Bearish.
Key Insights Summary
From a futures swing trader’s perspective, QQQ shows a fast countertrend recovery within a broader declining structure, rather than a confirmed trend reversal. The rebound from 647.05 reached evolving pivot resistance at 695.57, near the November grid center, before retreating below the grid’s lower boundary around 690. Short-term pivot improvement conflicts with mixed short-term benchmarks, while declining intermediate benchmarks and lower swing highs and lows preserve the broader bearish structure. Price remains near the 10-day and 200-day benchmark area around 681–682, with the 20-day benchmark near 699 overhead. Large daily ranges and a rising ATR plot indicate expanding volatility; the supplied ATR and VOLMA figures above cannot be independently verified from visible numerical labels. Weekly and yearly grids and named trade-signal summaries are not visible, so their neutral entries reflect unavailable confirmation. These are QQQ reference levels, not executable Nasdaq futures prices; futures basis and contract rollover can create differences. The image alone does not establish news or seasonal drivers.
Chart Analysis ATS AI Generated: 2026-11-12 15:11 for Informational use only, not trading advice. Terms and Risk Disclosure Copyright © 2026. Algo Trading Systems LLC.