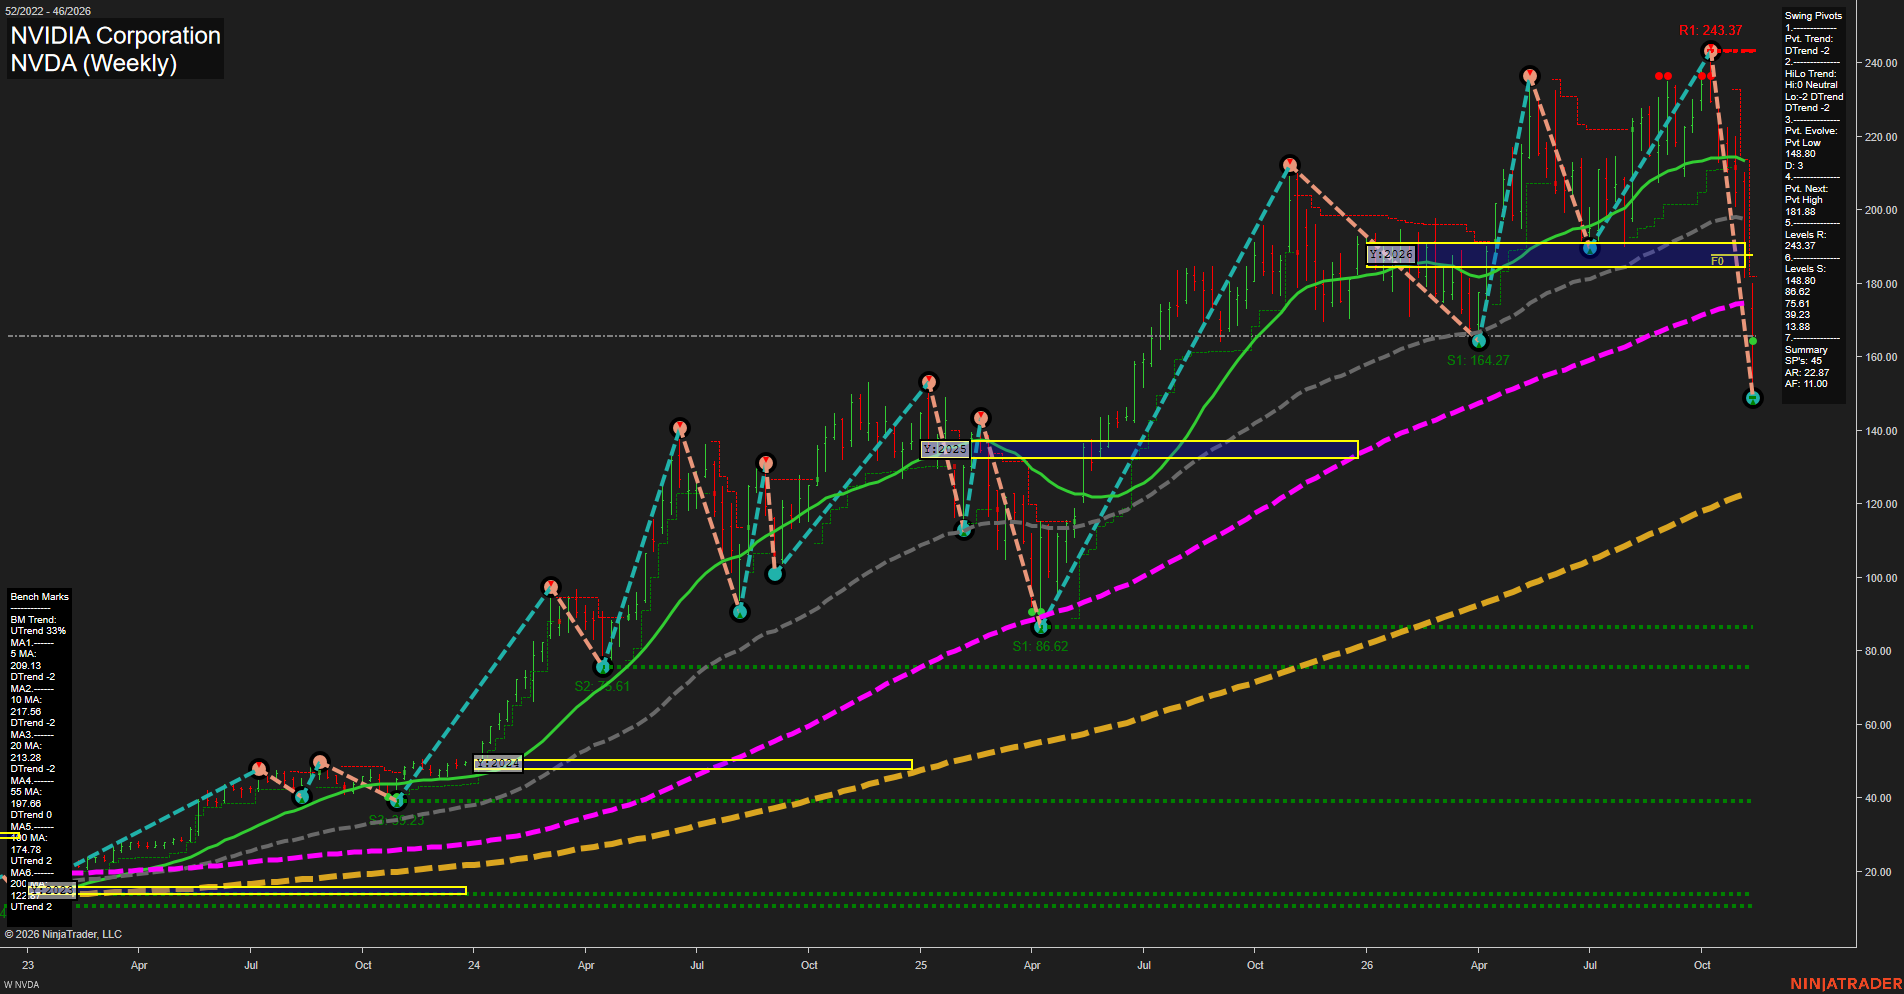
NVDA NVIDIA Corporation Weekly Chart Analysis: 2026-Nov-12 15:11 CT
Price Action
- Last: Approximately 166; exact black price marker is not legible,
- Bars: Large,
- Mom: Momentum fast to the downside.
WSFG Weekly
- Short-Term
- WSFG Current: NA%
- F0%/NTZ' Bias: Price Neutral,
- WSFG Trend: Neutral.
MSFG Month Nov
- Intermediate-Term
- MSFG Current: NA%
- F0%/NTZ' Bias: Price Neutral,
- MSFG Trend: Neutral.
YSFG Year 2026
- Long-Term
- YSFG Current: NA%
- F0%/NTZ' Bias: Price below NTZ,
- YSFG Trend: Bearish.
Swing Pivots
- (Short-Term) 1. Pvt. Trend: DTrend,
- (Intermediate-Term) 2. HiLo Trend: DTrend,
- 3. Pvt. Evolve: Pvt low 148.80,
- 4. Pvt. Next: Pvt high 181.88,
- 5. Levels R: 243.37,
- 6. Levels S: 148.80, 86.62, 75.61, 39.23, 13.88.
Weekly Benchmarks
- (Short-Term) 5 Day: 209.13 Down Trend,
- (Short-Term) 10 Day: 217.56 Down Trend,
- (Intermediate-Term) 20 Day: 213.28 Down Trend,
- (Intermediate-Term) 55 Day: 197.66 Flat Trend,
- (Long-Term) 100 Day: 174.78 Up Trend,
- (Long-Term) 200 Day: Approximately 122.7 Up Trend.
Overall Rating
- Short-Term: Bearish,
- Intermediate-Term: Bearish,
- Long-Term: Neutral.
Key Insights Summary
From a futures swing trader's perspective, this equity chart shows downside range expansion and a sharp reversal from 243.37, rather than an orderly pullback. The evolving low at 148.80 undercuts the prior 164.27 swing low, while the pivot summary confirms short- and intermediate-term downtrends. Price is below the declining shorter benchmarks, the flat 55-period benchmark and the rising 100-period benchmark. The 2026 yearly neutral zone near 185–191 has also been lost, reinforcing the bearish intermediate structure. The 181.88 next-pivot threshold is a structural reversal reference, not a confirmed recovery. Rising 100- and 200-period benchmarks preserve part of the longer-term advance, but price deterioration makes the long-term picture mixed. Weekly and monthly grids and the specified recent trade signals are not displayed; their neutral entries reflect unavailable confirmation. News catalysts and seasonal effects cannot be established from this chart, and futures-specific volume, open interest and basis are absent.
Chart Analysis ATS AI Generated: 2026-11-12 15:11 for Informational use only, not trading advice. Terms and Risk Disclosure Copyright © 2026. Algo Trading Systems LLC.