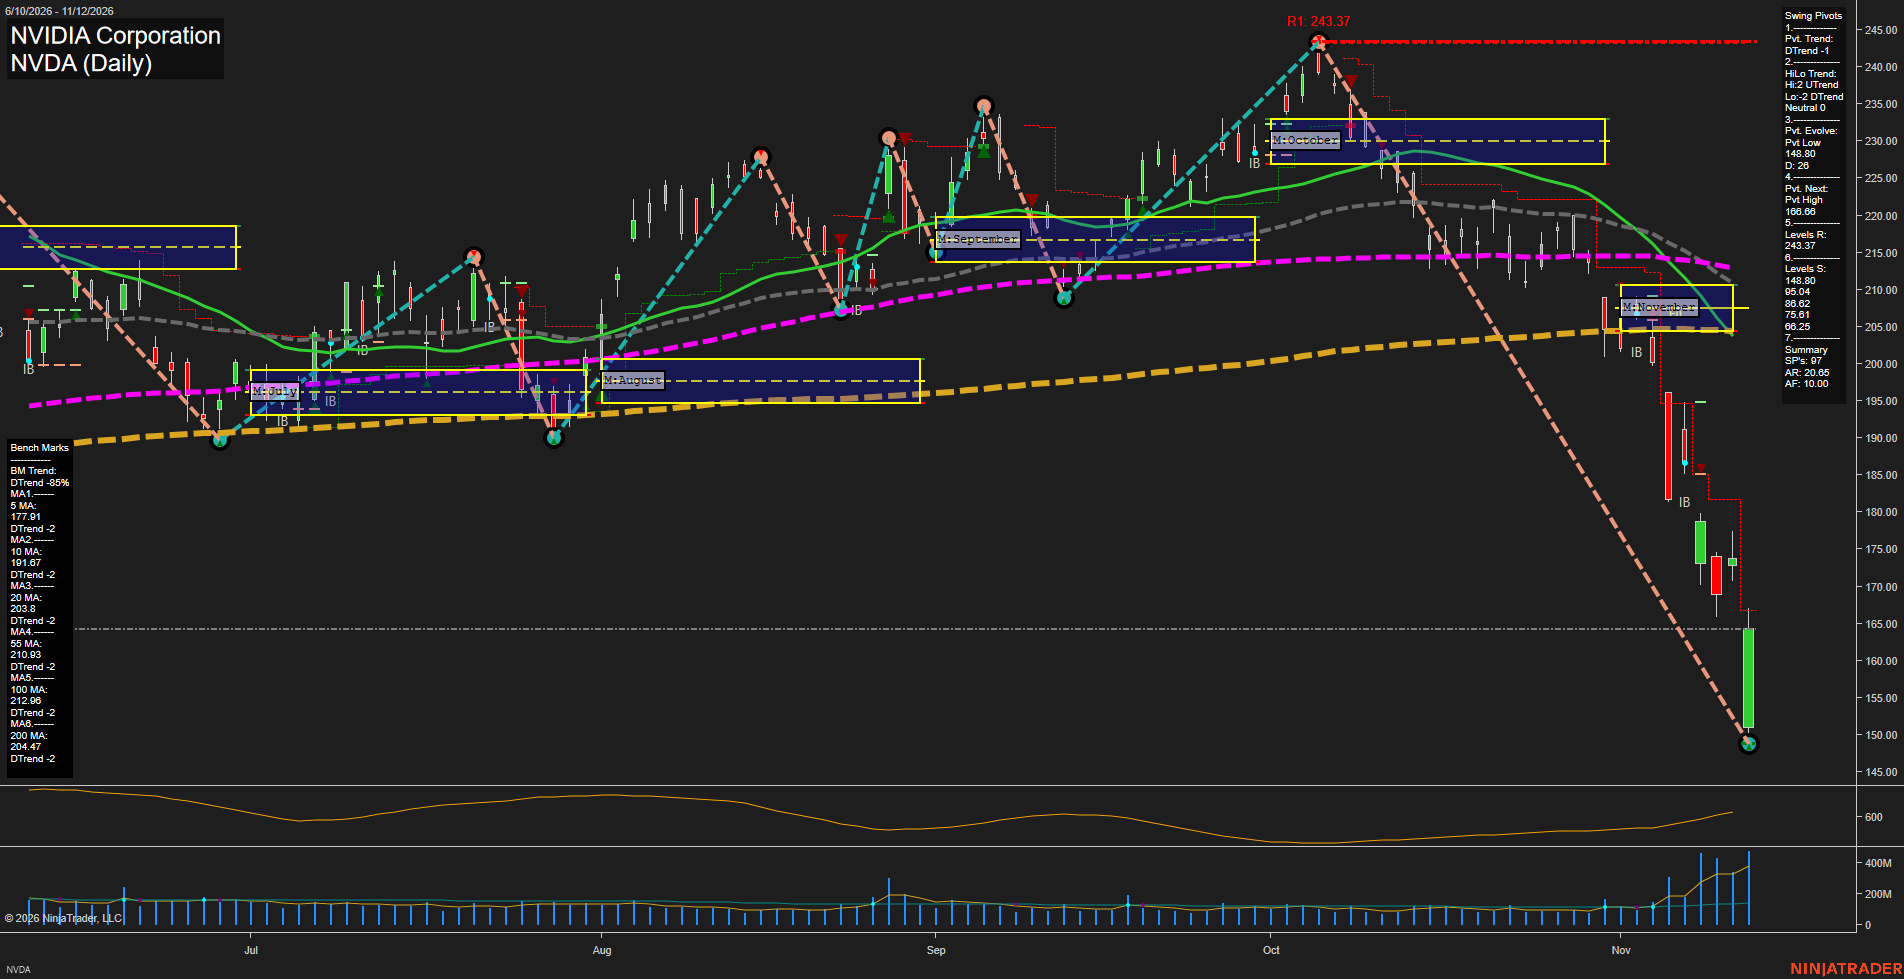
NVDA NVIDIA Corporation Daily Chart Analysis: 2026-Nov-12 15:11 CT
Price Action
- Last: Approximately 164.30 (price marker not legible),
- Bars: Large,
- Mom: Fast downside momentum with a sharp latest-session rebound.
WSFG Weekly
- Short-Term
- WSFG Current: NA%
- F0%/NTZ' Bias: Price Neutral,
- WSFG Trend: Neutral.
MSFG Month Nov
- Intermediate-Term
- MSFG Current: NA%
- F0%/NTZ' Bias: Price below F0% and NTZ,
- MSFG Trend: Bearish.
YSFG Year 2026
- Long-Term
- YSFG Current: NA%
- F0%/NTZ' Bias: Price Neutral,
- YSFG Trend: Neutral.
Swing Pivots
- (Short-Term) 1. Pvt. Trend: DTrend,
- (Intermediate-Term) 2. HiLo Trend: Neutral (highs UTrend, lows DTrend),
- 3. Pvt. Evolve: Pvt low 148.80,
- 4. Pvt. Next: Pvt high 186.66,
- 5. Levels R: 243.37,
- 6. Levels S: 148.80, 95.04, 88.62, 75.61, 66.25.
Daily Benchmarks
- (Short-Term) 5 Day: 177.91 Down Trend,
- (Short-Term) 10 Day: 191.67 Down Trend,
- (Intermediate-Term) 20 Day: 203.80 Down Trend,
- (Intermediate-Term) 55 Day: 210.93 Down Trend,
- (Long-Term) 100 Day: 212.96 Down Trend,
- (Long-Term) 200 Day: 204.47 Down Trend.
Additional Metrics
- ATR: 599,
- VOLMA: 346637249.
Overall Rating
- Short-Term: Bearish,
- Intermediate-Term: Bearish,
- Long-Term: Bearish.
Key Insights Summary
From a futures swing trader's perspective, this equity chart shows an accelerating downside expansion rather than an established bullish reversal. The developing swing from 243.37 to 148.80 represents approximately 39% peak-to-trough damage. Large daily ranges, rising ATR and elevated volume accompany the breakdown, consistent with liquidation pressure, although the chart cannot establish its cause. The latest strong rebound remains below every benchmark moving average and the November NTZ near 204–211, making it a countertrend recovery within the prevailing decline. The summary identifies 186.66 as the next pivot-reversal threshold, not a confirmed resistance pivot. Intermediate pivot structure is mixed, but monthly positioning and both intermediate benchmarks remain bearish. Weekly and yearly grids and the requested named trade-signal series are not visible; their neutral entries are placeholders rather than confirmed readings. News catalysts and seasonal effects cannot be established from this image. ATR is reproduced in the supplied indicator units, not interpreted as 599 dollars or futures ticks.
Chart Analysis ATS AI Generated: 2026-11-12 15:11 for Informational use only, not trading advice. Terms and Risk Disclosure Copyright © 2026. Algo Trading Systems LLC.