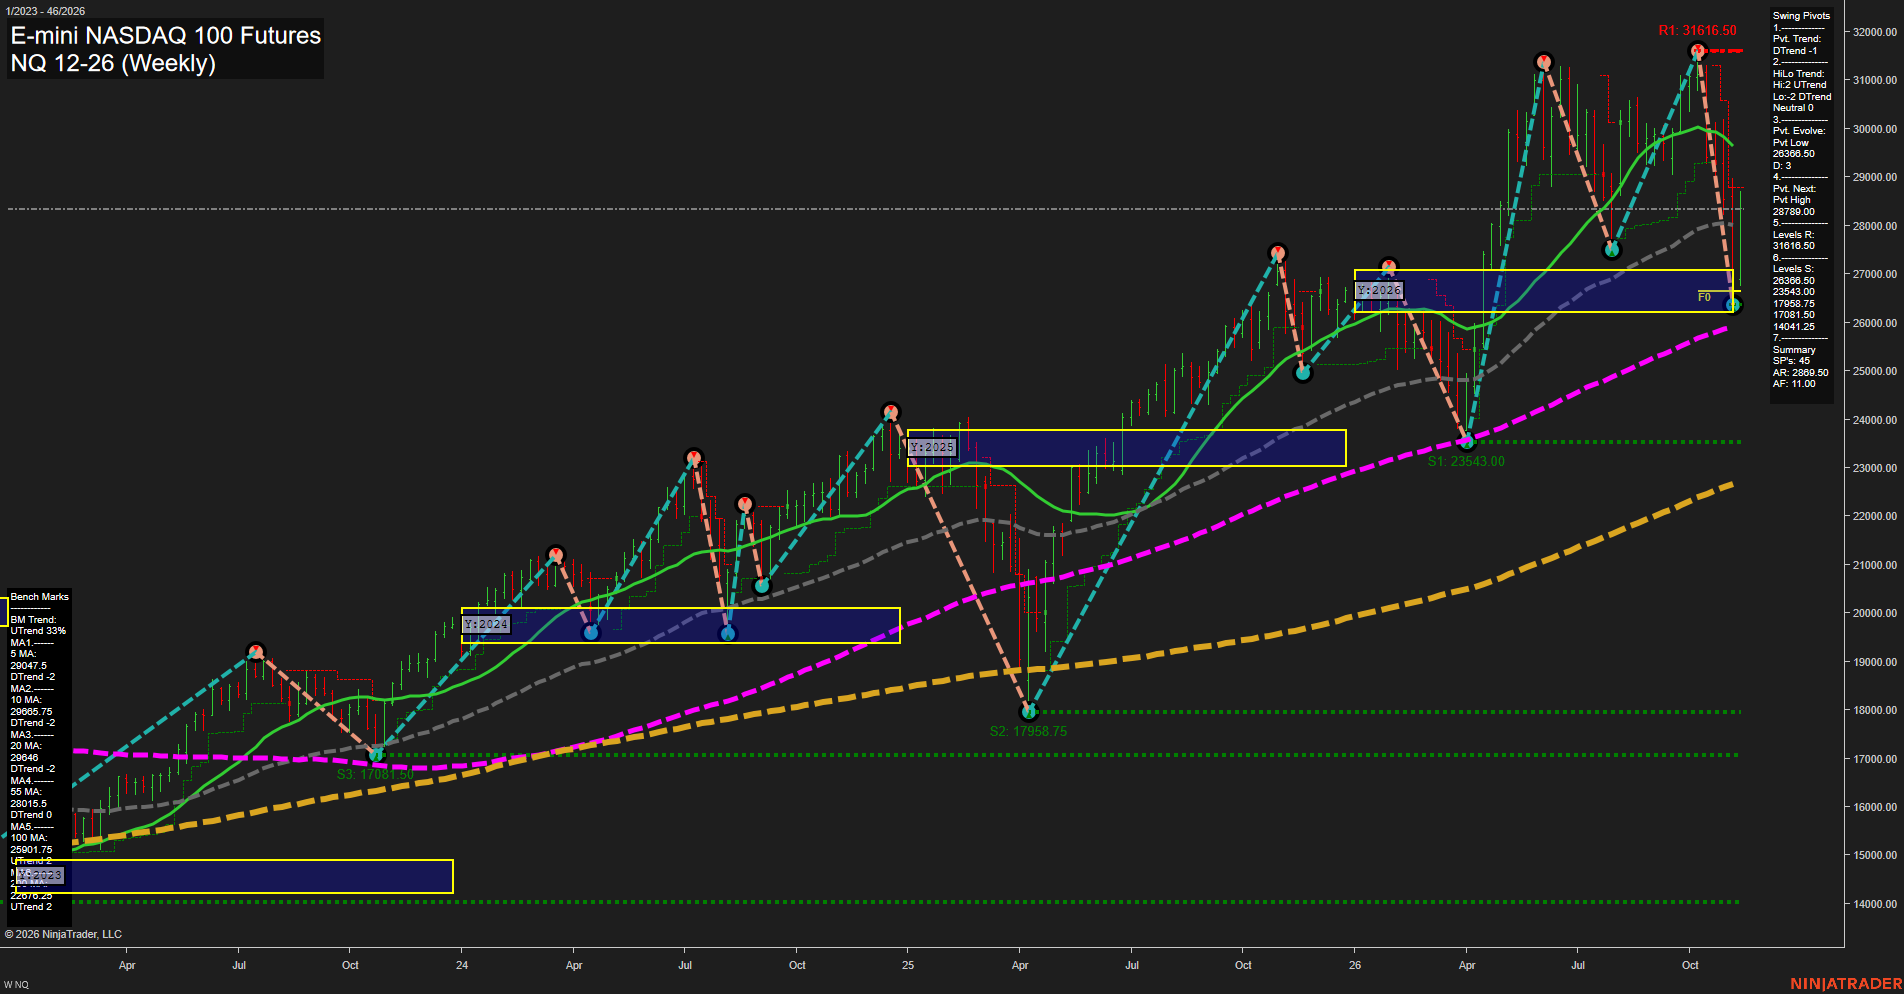
NQ E-mini NASDAQ 100 Futures Weekly Chart Analysis: 2026-Nov-12 15:10 CT
Price Action
- Last: Not legible; black price marker not visible,
- Bars: Large,
- Mom: Fast, with a sharp downswing followed by a substantial rebound.
WSFG Weekly
- Short-Term
- WSFG Current: 82%
- F0%/NTZ' Bias: Price Above,
- WSFG Trend: Up.
MSFG Month Nov
- Intermediate-Term
- MSFG Current: -8%
- F0%/NTZ' Bias: Price Below,
- MSFG Trend: Down.
YSFG Year 2026
- Long-Term
- YSFG Current: 40%
- F0%/NTZ' Bias: Price Above,
- YSFG Trend: Up.
Swing Pivots
- (Short-Term) 1. Pvt. Trend: DTrend,
- (Intermediate-Term) 2. HiLo Trend: Neutral; highs UTrend, lows DTrend,
- 3. Pvt. Evolve: Pvt low 26366.50,
- 4. Pvt. Next: Pvt high 28789.00,
- 5. Levels R: 31616.50,
- 6. Levels S: 26366.50, 23543.00, 17958.75, 17081.50, 14041.25.
Weekly Benchmarks
- (Short-Term) 5 Day: 29047.5 Down Trend,
- (Short-Term) 10 Day: 29665.75 Down Trend,
- (Intermediate-Term) 20 Day: 29646 Down Trend,
- (Intermediate-Term) 55 Day: 28015.5 Down Trend,
- (Long-Term) 100 Day: 25901.75 Up Trend,
- (Long-Term) 200 Day: 22670.25 Up Trend.
Recent Trade Signals
- 09 Nov 2026: Long NQ 12-26 @ 27927 Signals.USAR.TR120
- 09 Nov 2026: Long NQ 12-26 @ 27076 Signals.USAR-WSFG
Overall Rating
- Short-Term: Bullish,
- Intermediate-Term: Bearish,
- Long-Term: Bullish.
Key Insights Summary
The swing-trading picture is a short-term recovery within an unresolved intermediate-term correction. Weekly grid strength and the two supplied long signals favor the rebound, but the pivot trend remains down until the displayed 28789.00 reversal threshold is met. Higher pivot highs combined with lower pivot lows indicate an expanding, volatile range rather than an orderly intermediate uptrend. The decline from 31616.50 reached the yearly neutral-zone area near 26366.50 before rebounding sharply. Falling 5-, 10-, 20- and 55-period benchmarks contrast with rising 100- and 200-period benchmarks, distinguishing near-term damage from the still-positive major trend. The monthly grid remains negative despite weekly and yearly strength. No news catalyst or seasonal effect can be established from this chart alone.
Chart Analysis ATS AI Generated: 2026-11-12 15:11 for Informational use only, not trading advice. Terms and Risk Disclosure Copyright © 2026. Algo Trading Systems LLC.