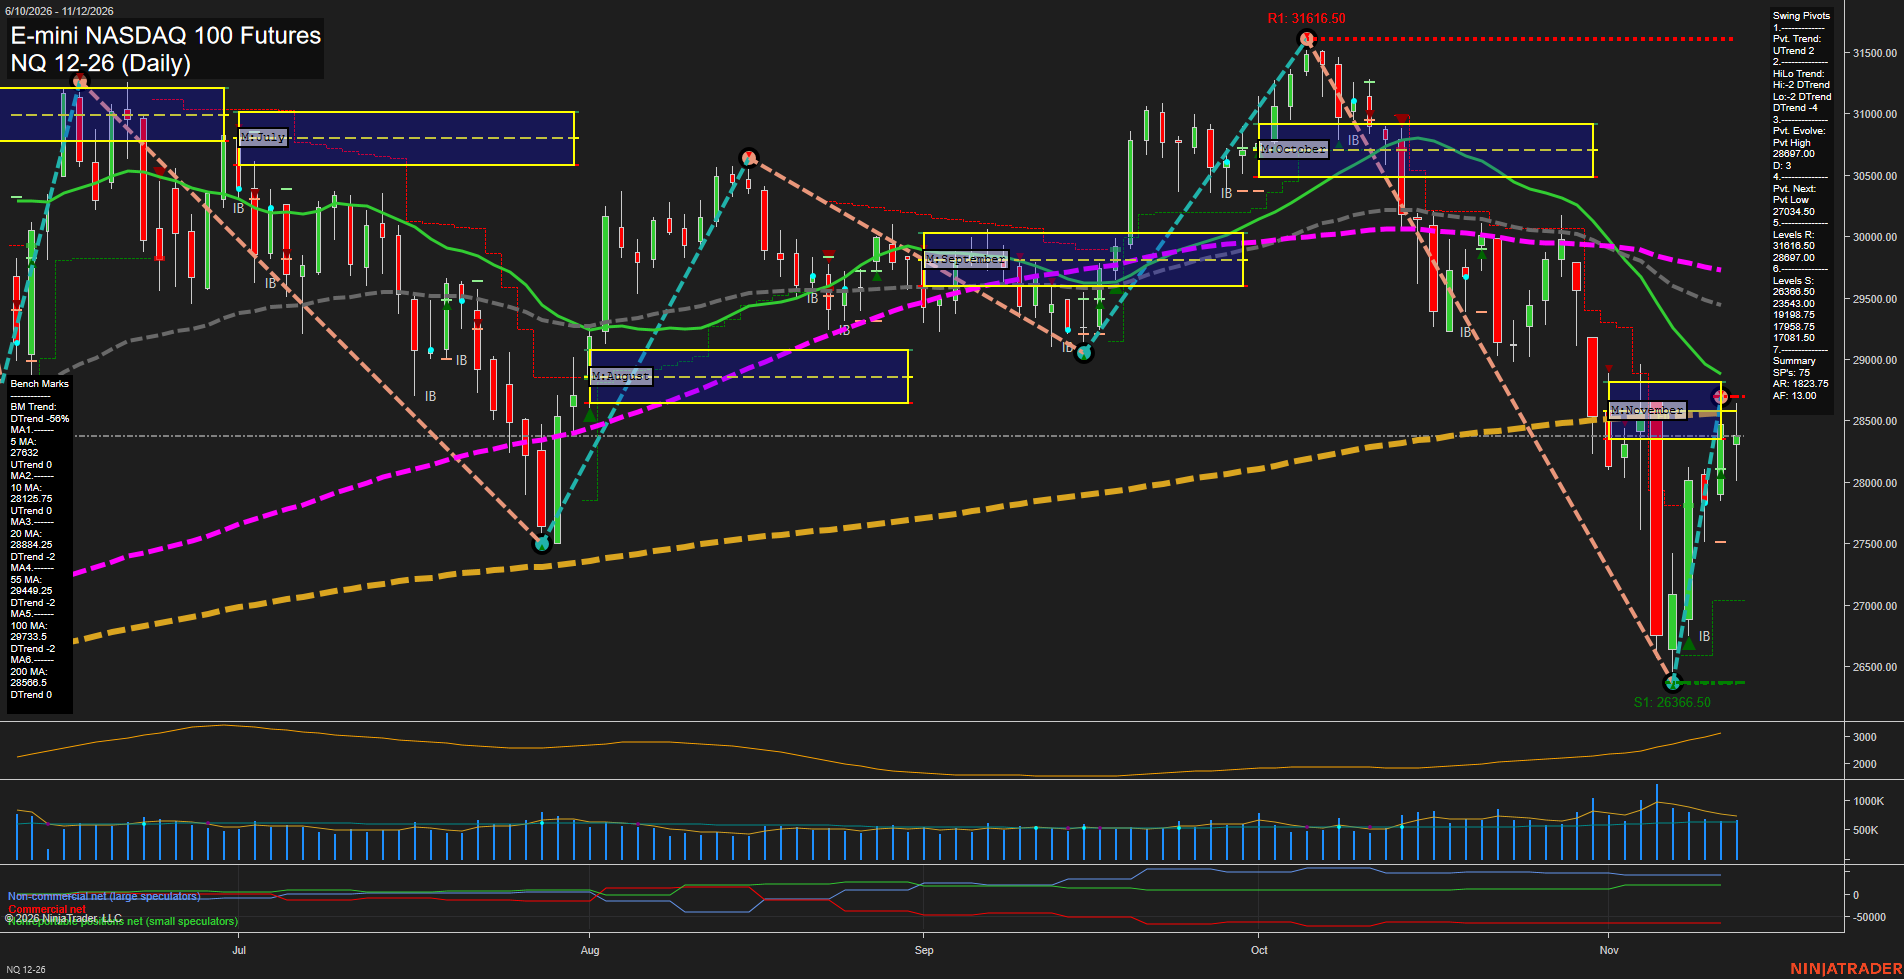
NQ E-mini NASDAQ 100 Futures Daily Chart Analysis: 2026-Nov-12 15:10 CT
Price Action
- Last: Approximately 28375; exact price marker not visible,
- Bars: Small latest bar following large reversal bars,
- Mom: Fast rebound momentum slowing near resistance.
WSFG Weekly
- Short-Term
- WSFG Current: 82%
- F0%/NTZ' Bias: Price Above,
- WSFG Trend: Up.
MSFG Month Nov
- Intermediate-Term
- MSFG Current: -8%
- F0%/NTZ' Bias: Price Below,
- MSFG Trend: Down.
YSFG Year 2026
- Long-Term
- YSFG Current: 40%
- F0%/NTZ' Bias: Price Above,
- YSFG Trend: Up.
Swing Pivots
- (Short-Term) 1. Pvt. Trend: UTrend,
- (Intermediate-Term) 2. HiLo Trend: DTrend,
- 3. Pvt. Evolve: Pvt high 28697.00,
- 4. Pvt. Next: Pvt low 27034.50,
- 5. Levels R: 31616.50, 28697.00,
- 6. Levels S: 26366.50, 23543.00, 19198.75, 17958.75, 17081.50.
Daily Benchmarks
- (Short-Term) 5 Day: 27632 Up Trend,
- (Short-Term) 10 Day: 28125.75 Up Trend,
- (Intermediate-Term) 20 Day: 28884.25 Down Trend,
- (Intermediate-Term) 55 Day: 29449.25 Down Trend,
- (Long-Term) 100 Day: 29733.5 Down Trend,
- (Long-Term) 200 Day: 28566.5 Down Trend.
Additional Metrics
- ATR: 2753,
- VOLMA: 824528.
Recent Trade Signals
- 09 Nov 2026: Long NQ 12-26 @ 27927 Signals.USAR.TR120
- 09 Nov 2026: Long NQ 12-26 @ 27076 Signals.USAR-WSFG
Overall Rating
- Short-Term: Bullish,
- Intermediate-Term: Bearish,
- Long-Term: Bearish.
Key Insights Summary
The swing-trading picture is a sharp countertrend recovery within a broader declining structure. The rebound from 26366.50 to an evolving pivot high of 28697.00 has turned the short-term pivot trend and both fast benchmarks upward, consistent with the weekly grid and November 9 long signals. However, the intermediate pivot structure still shows declining highs and lows, while price remains below the falling 20-, 55- and 100-day benchmarks. The 200-day benchmark at 28566.5 and pivot resistance at 28697.00 form an overhead resistance cluster; the latest small candle reflects a pause after the rapid recovery. Monthly weakness contrasts with positive weekly and yearly grid readings, explaining the divergence between bullish short-term momentum and bearish broader benchmark evidence. Elevated ATR underscores the unusually wide recent swings. The image does not establish a news catalyst or validate a seasonal explanation.
Chart Analysis ATS AI Generated: 2026-11-12 15:10 for Informational use only, not trading advice. Terms and Risk Disclosure Copyright © 2026. Algo Trading Systems LLC.